
Metrics frameworks provide systems for selecting, defining, and monitoring measures that reflect progress toward outcomes. They connect qualitative goals to quantitative signals across customer, product, and operational dimensions. These approaches matter whenever evidence should guide decisions. Use them to improve learning, focus, and accountability across teams.
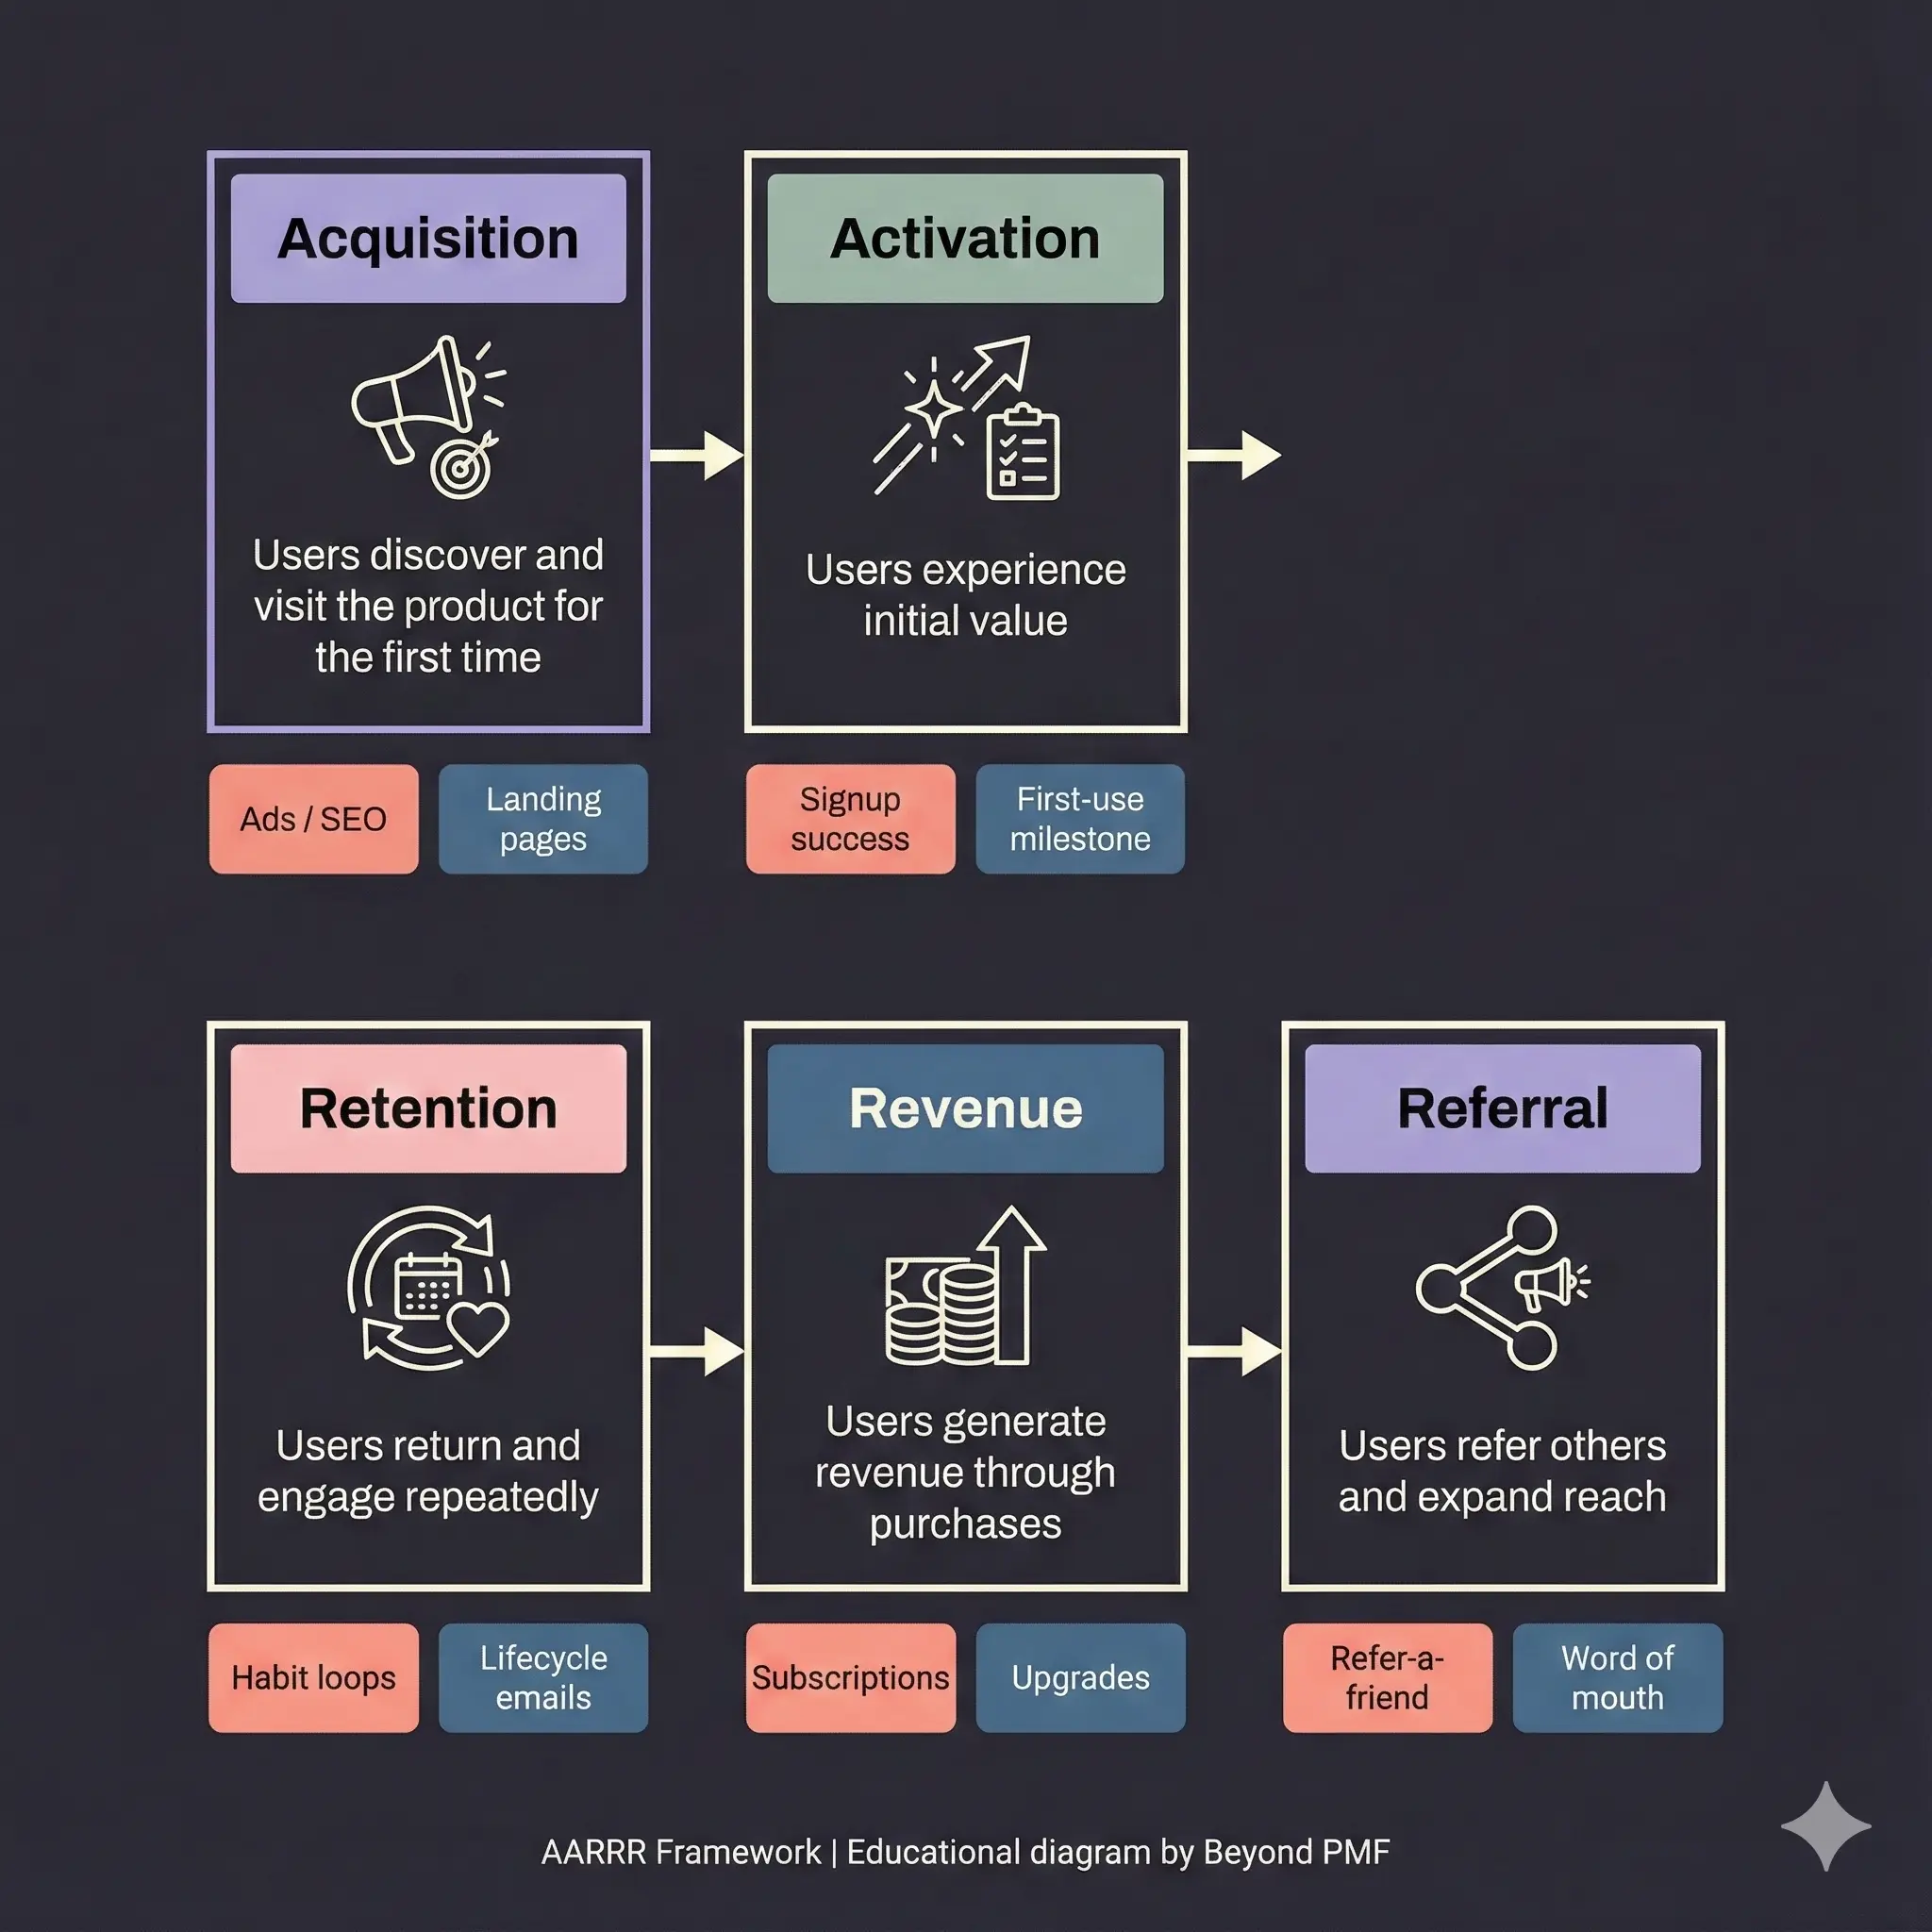
The AARRR framework, also known as Pirate Metrics, was developed by Dave McClure and serves as a roadmap for startups to focus on critical metrics that drive growth. It breaks down the customer lifecycle into five sequential stages: Acquisition, Activation, Retention, Revenue, and Referral. This framework helps businesses to identify weaknesses in the user experience and optimize strategies for each stage, ultimately leading to increased user engagement and profitability.
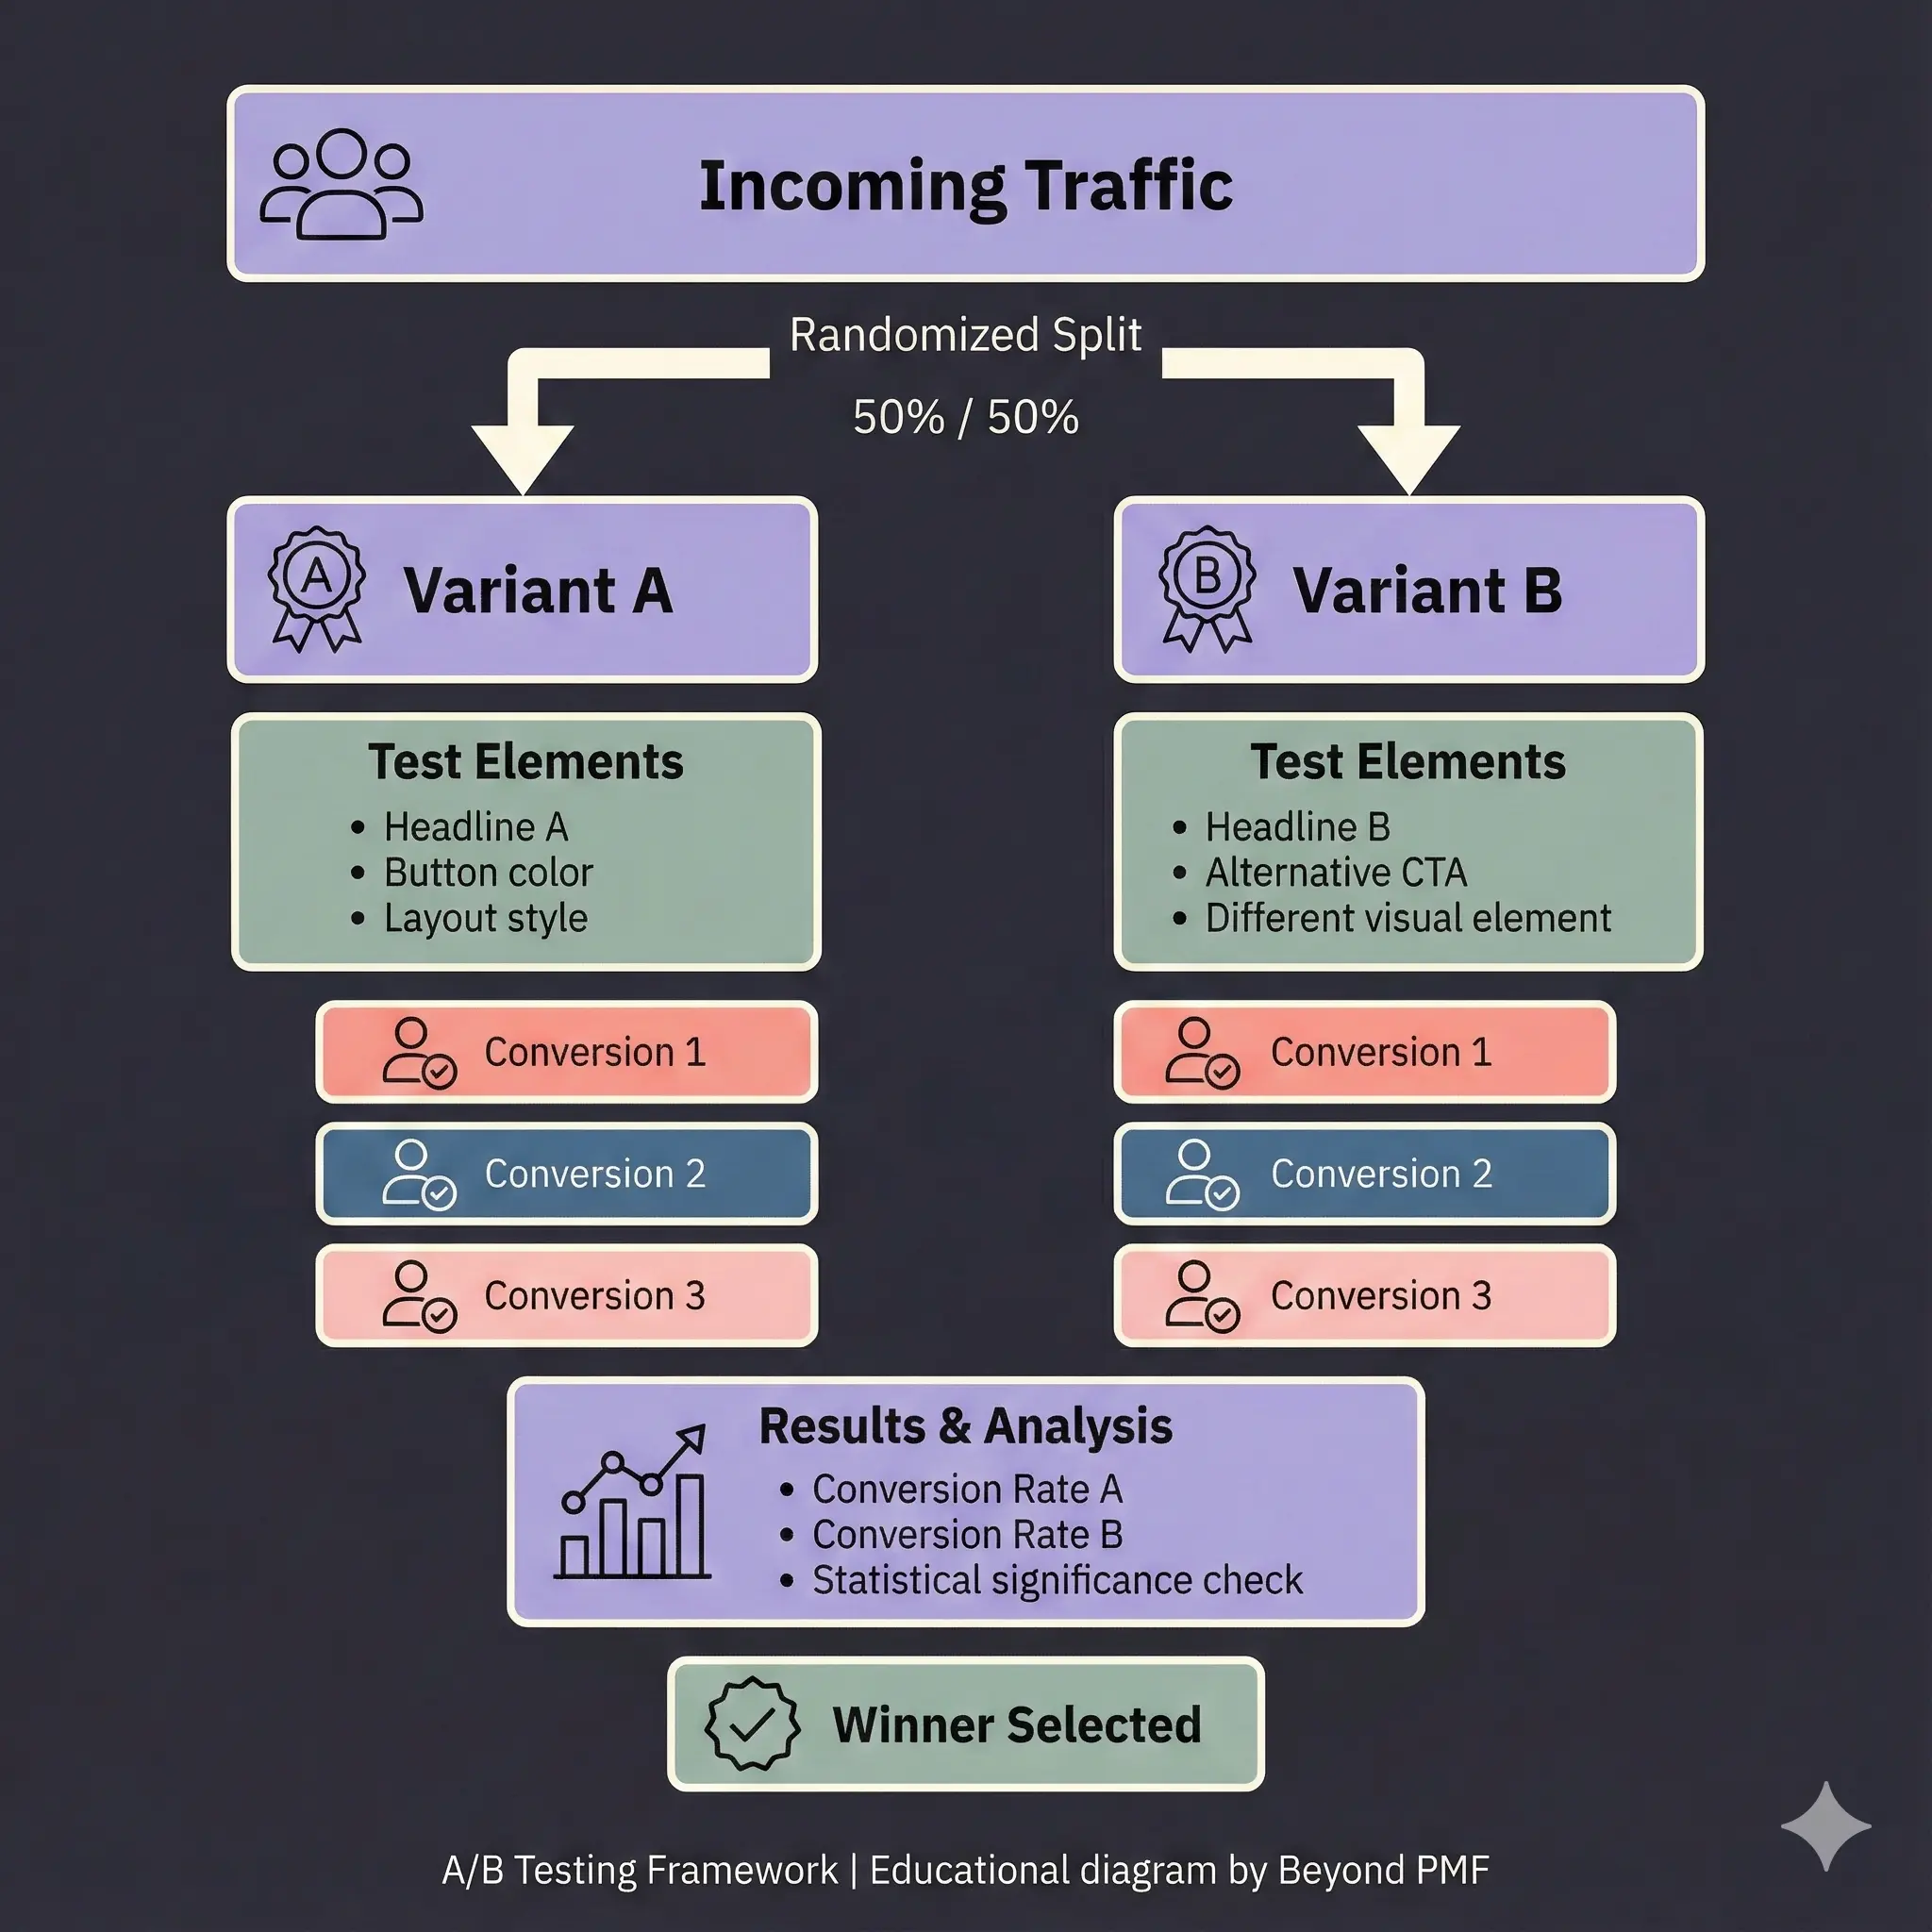
The A/B Testing Framework is a systematic approach used in marketing and user experience design to compare two versions of a digital asset by showing them to different segments of visitors at the same time and measuring the effect on a predefined metric, usually conversion rate. This method helps in making data-driven decisions and increases the effectiveness of marketing content.

The Analytics Maturity Model provides a structured approach for organizations to evaluate their current analytics practices, identify areas for improvement, and develop a roadmap towards advanced data-driven decision-making. This model helps businesses understand their current position in terms of data utilization and guides them through the stages of becoming more sophisticated in using analytics to drive business outcomes. The benefits of using this model include improved decision-making processes, enhanced operational efficiency, and increased competitive advantage.

The Balanced Scorecard (BSC) is a strategic management tool that provides a comprehensive framework for translating an organization's strategic objectives into a coherent set of performance measures. Developed by Robert Kaplan and David Norton in the early 1990s, the BSC is used to measure and provide feedback to organizations. Beyond traditional financial metrics, it includes performance metrics from three additional perspectives: customer, internal business processes, and learning and growth. This holistic approach ensures that the strategy is balanced and aligned with long-term goals, facilitating strategic planning and management.
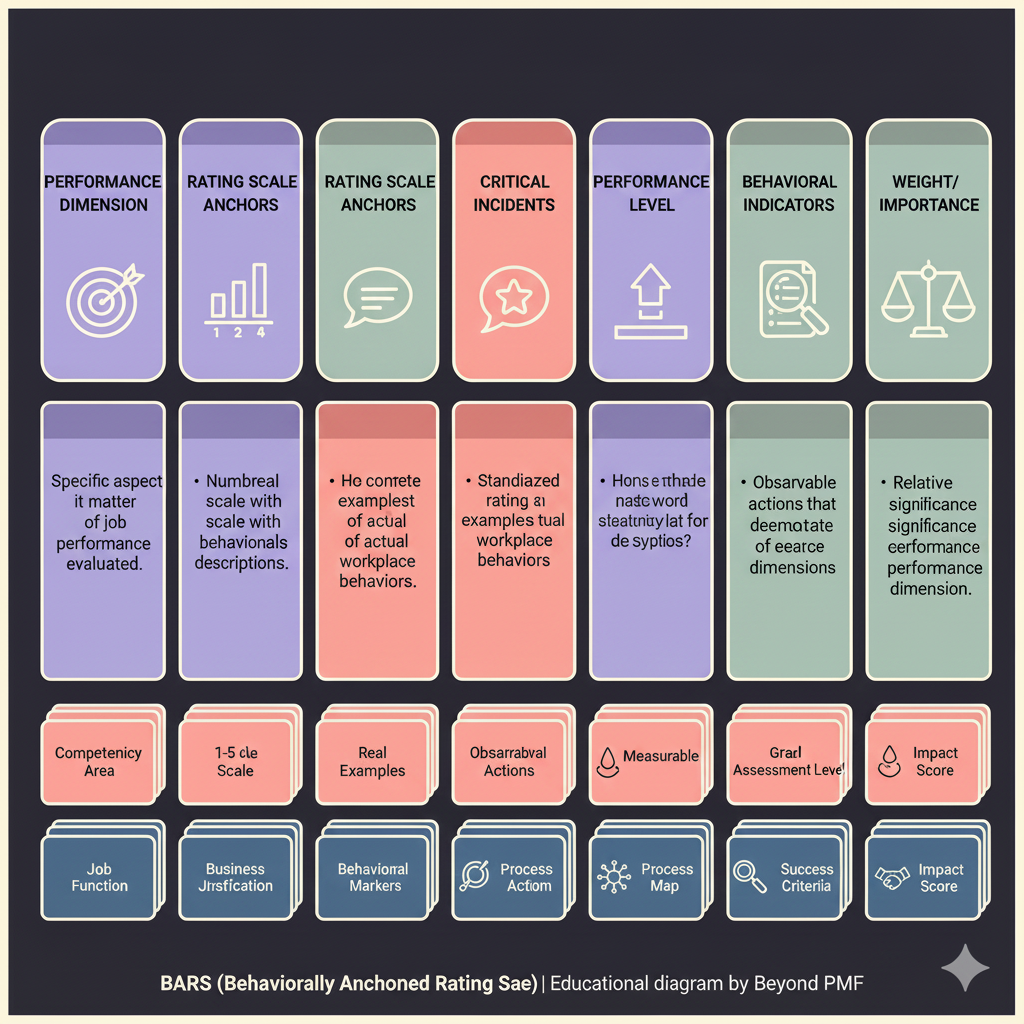
Behaviorally Anchored Rating Scales (BARS) is a quantitative and qualitative method for performance evaluation. This framework combines elements from traditional rating scales and critical incidents methods to provide a more comprehensive analysis of an employee's performance. BARS is used to improve the accuracy of performance evaluations, reduce rating errors, and align employee behaviors with the organization's goals. It benefits organizations by providing clearer standards and a more precise measurement of performance.
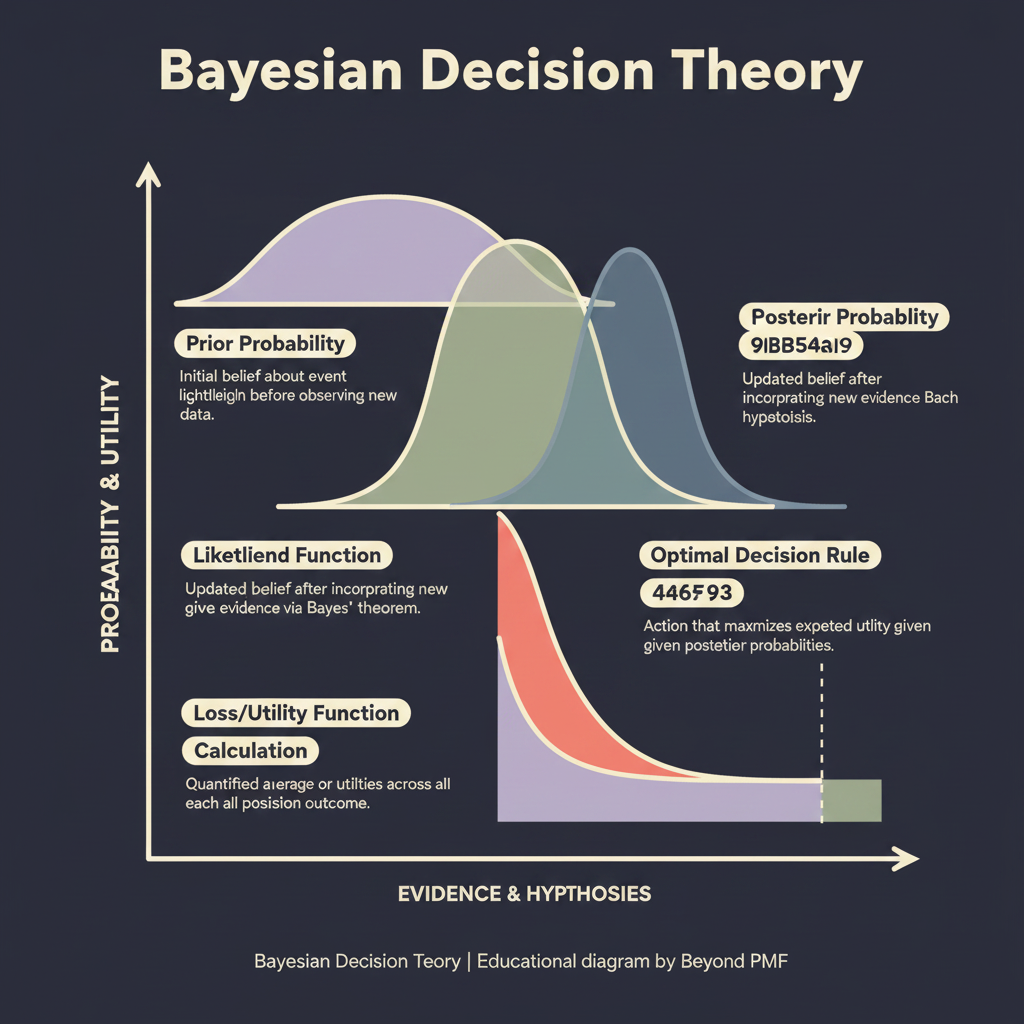
Bayesian Decision Theory is a framework that combines Bayesian inference and decision theory. It is used to make optimal decisions by updating beliefs based on new evidence and calculating the expected utility of different actions. This approach is particularly beneficial in complex decision-making environments where the probabilities of outcomes are uncertain and continuously updated as new data becomes available.

The Benchmarking Framework involves identifying the best firms in the same industry, or in another industry where similar processes exist, and comparing the results and processes of those studied (the 'targets') to one's own results and processes. It is used to gain insights that can help organizations improve their performance by understanding the most effective operating practices from others. This framework helps in identifying areas of improvement, setting goals, and implementing best practices to achieve competitive advantage.

The CIPP Evaluation Model, standing for Context, Input, Process, and Product, is a framework designed to assess different aspects of programs and projects. It helps organizations in making informed decisions by evaluating the planning, implementation, and effectiveness of their initiatives. The model is widely appreciated for its holistic approach, which not only assesses the outcomes but also the strategies, processes, and contextual factors influencing them.

Cost-Benefit Analysis is a financial decision-making tool used to assess the economic pros and cons of a project or decision. It involves calculating and comparing the benefits and costs of a project, decision, or policy. This analysis helps in determining the net economic impact and aids stakeholders in making informed choices by quantifying financial, social, and environmental factors. The primary benefit of using CBA is its ability to provide a clear picture of the economic viability of decisions, promoting more efficient resource allocation.
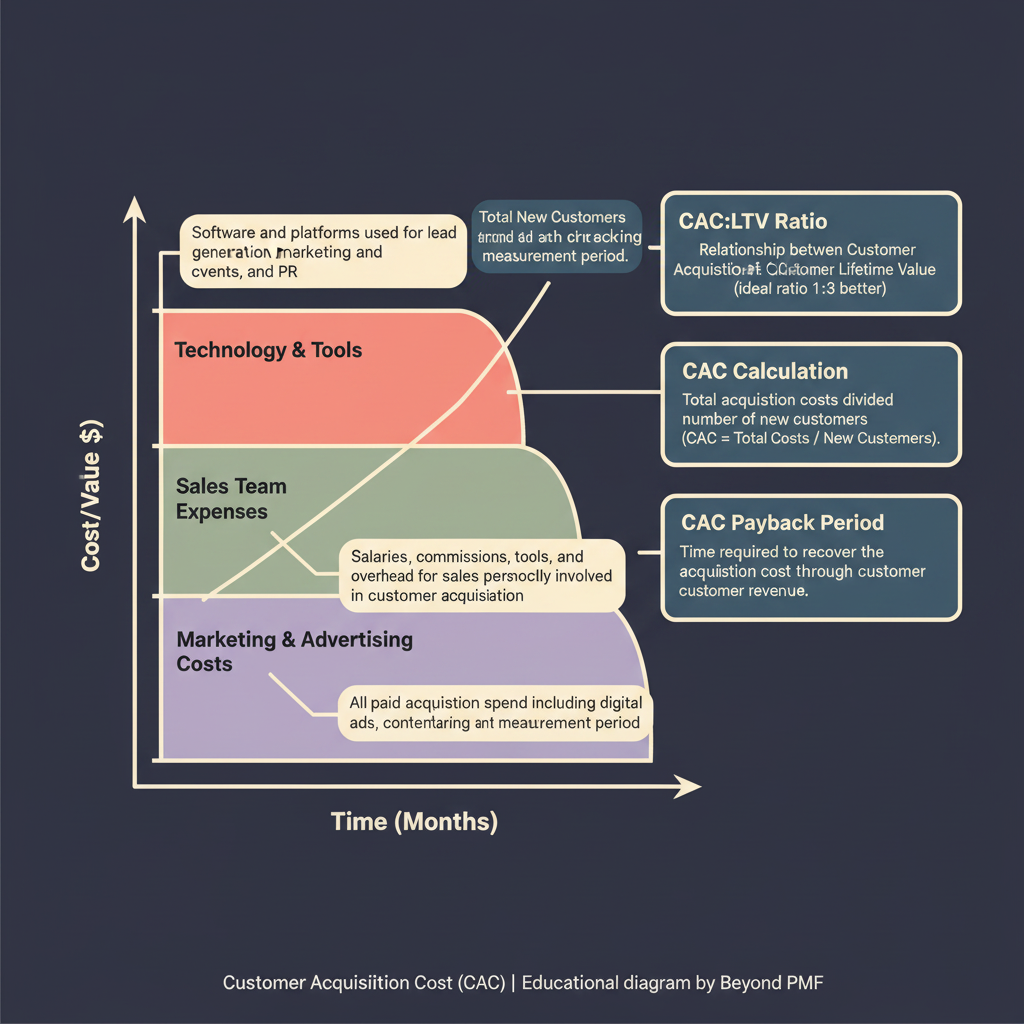
The Customer Acquisition Cost (CAC) Framework is a financial metric used by businesses to evaluate the total cost of acquiring a new customer. This includes all marketing and sales expenses divided by the number of new customers acquired over a specific period. It is essential for determining the profitability of different marketing strategies, optimizing marketing spend, and ensuring sustainable business growth. Understanding CAC helps companies make informed decisions about how much they are willing to spend to gain a new customer.
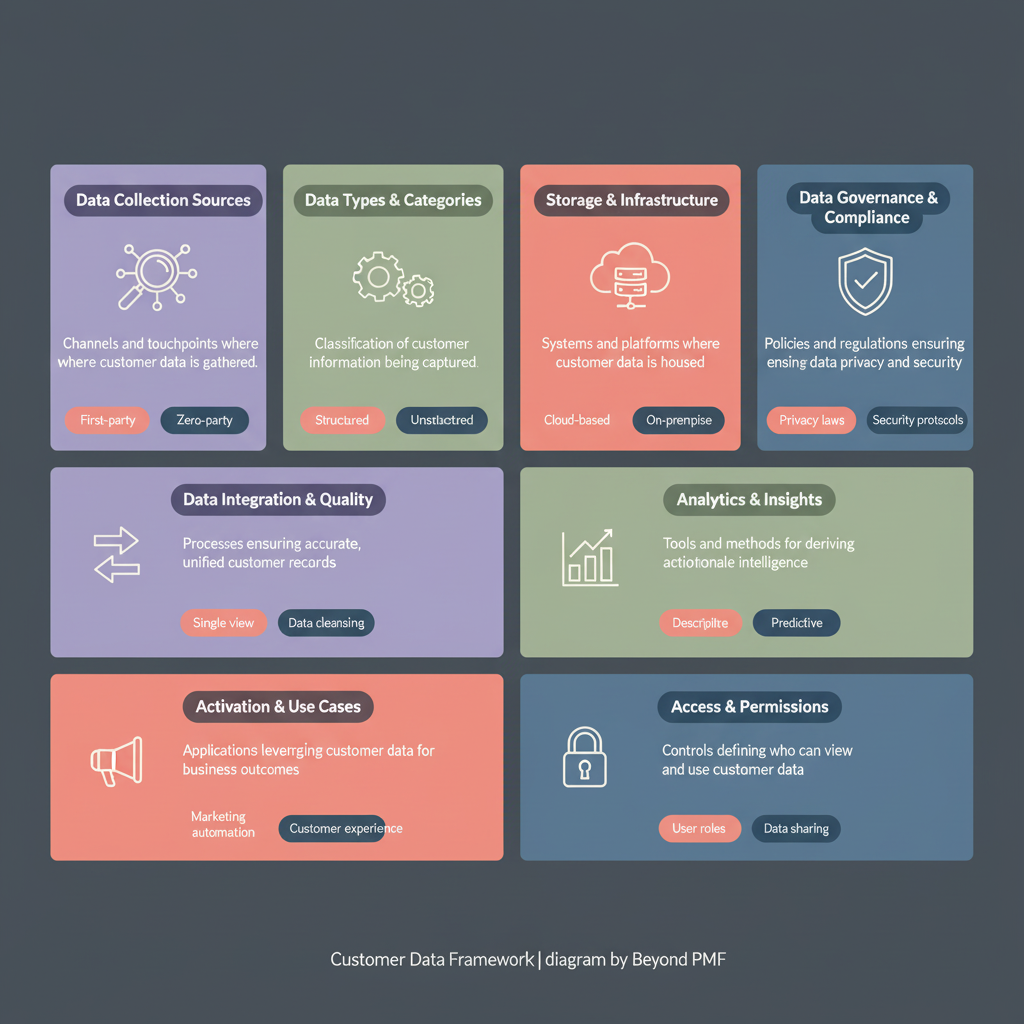
The Customer Data Framework provides a systematic methodology for handling and utilizing customer information effectively. It integrates various data management practices to ensure data accuracy, accessibility, and security. The framework helps organizations in making informed decisions, improving customer interactions, and personalizing marketing efforts. Its use leads to better customer insights, enhanced customer satisfaction, and increased profitability.
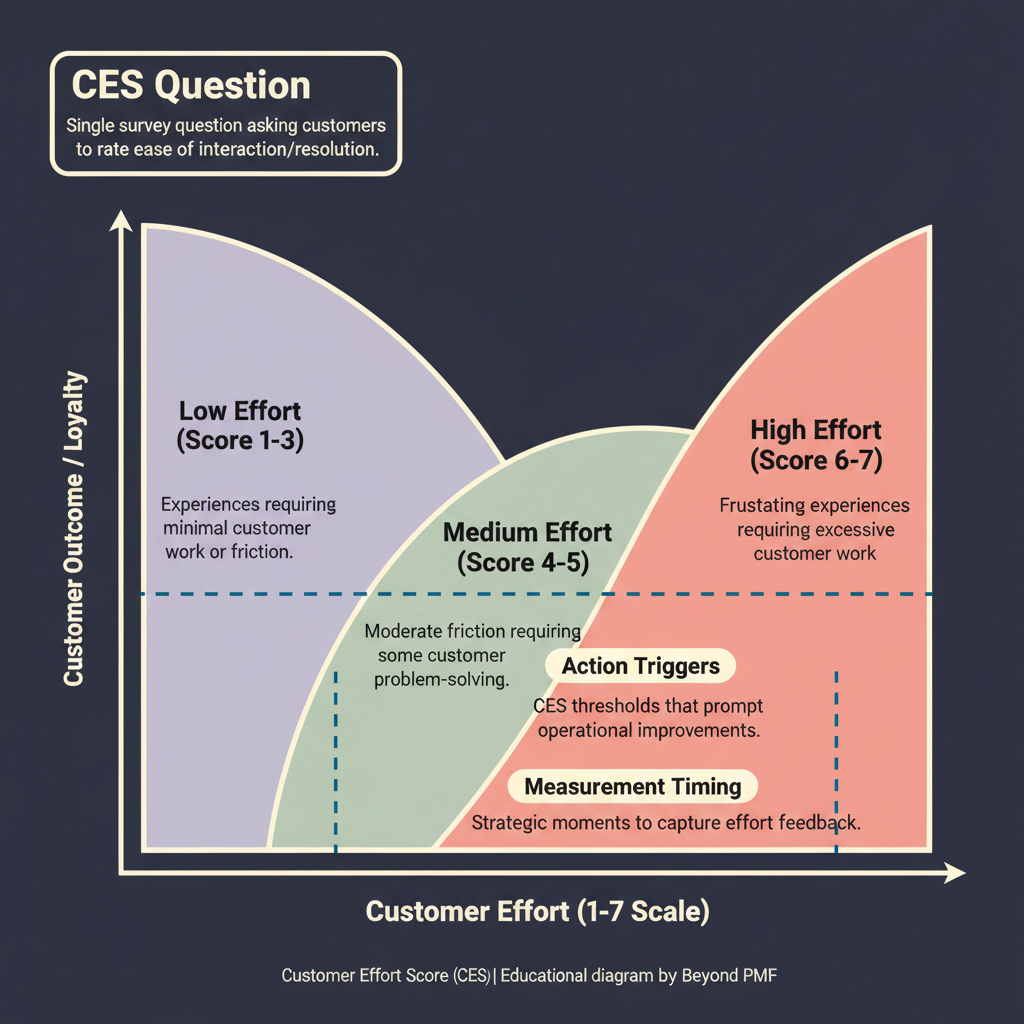
Customer Effort Score (CES) is a customer service evaluation metric that measures the ease of service experience from the customer's perspective. It asks customers to rate the effort they had to exert to get their issues resolved, typically on a scale from 'very easy' to 'very difficult'. This metric is crucial for businesses aiming to streamline customer interactions, reduce friction, and enhance overall customer satisfaction. Implementing CES can lead to improved customer loyalty and better resource allocation.

Customer Lifecycle Analysis is a strategic framework that helps businesses understand the different stages a customer goes through from initial awareness to post-purchase behaviors. It is used to tailor marketing strategies, improve customer service, and optimize the customer journey. The framework provides insights into customer behavior, preferences, and needs, enabling companies to enhance customer satisfaction and loyalty.

The Customer Satisfaction Score (CSAT) is a straightforward metric used to gauge the satisfaction levels of customers regarding a specific product, service, or interaction. It typically involves asking customers to rate their satisfaction on a scale, often from 1 to 5. CSAT is a valuable tool for businesses to quickly assess customer feelings and identify areas for improvement. Its simplicity and directness make it a popular choice among businesses of all sizes to measure customer sentiment.

Data-Informed Decision-Making (DIDM) is a framework that emphasizes the use of data as a critical element in making business decisions. It involves collecting, analyzing, and interpreting data to guide strategic and operational decisions. The framework helps organizations to make decisions that are not only based on intuition or past experiences but are supported by empirical evidence. This approach can lead to more effective strategies, improved operational efficiency, and enhanced competitive advantage.
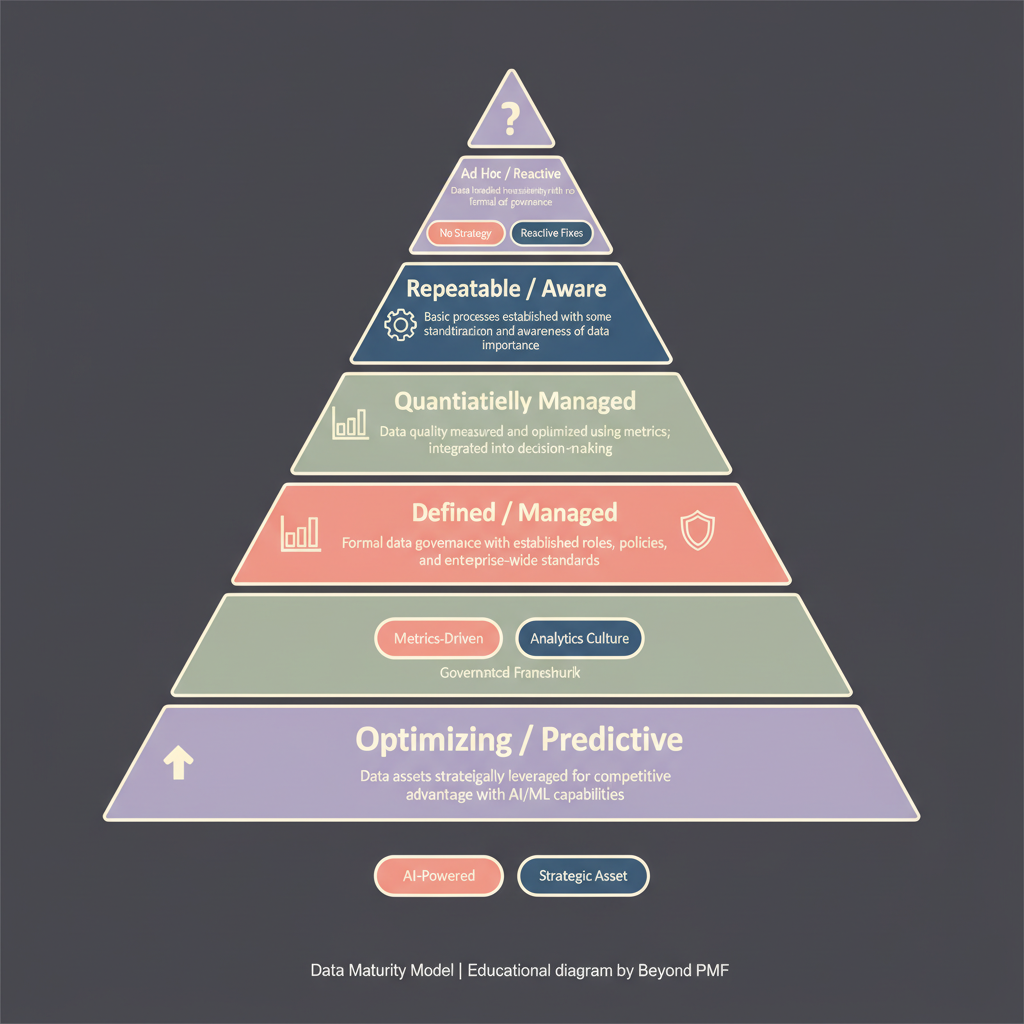
The Data Maturity Model is a framework designed to evaluate and enhance an organization's data management and utilization capabilities. It provides a structured approach to identifying the current level of data maturity, setting realistic goals for improvement, and implementing best practices in data handling and analysis. This model is crucial for organizations aiming to leverage data for strategic advantage, ensuring that data practices evolve in alignment with business goals.
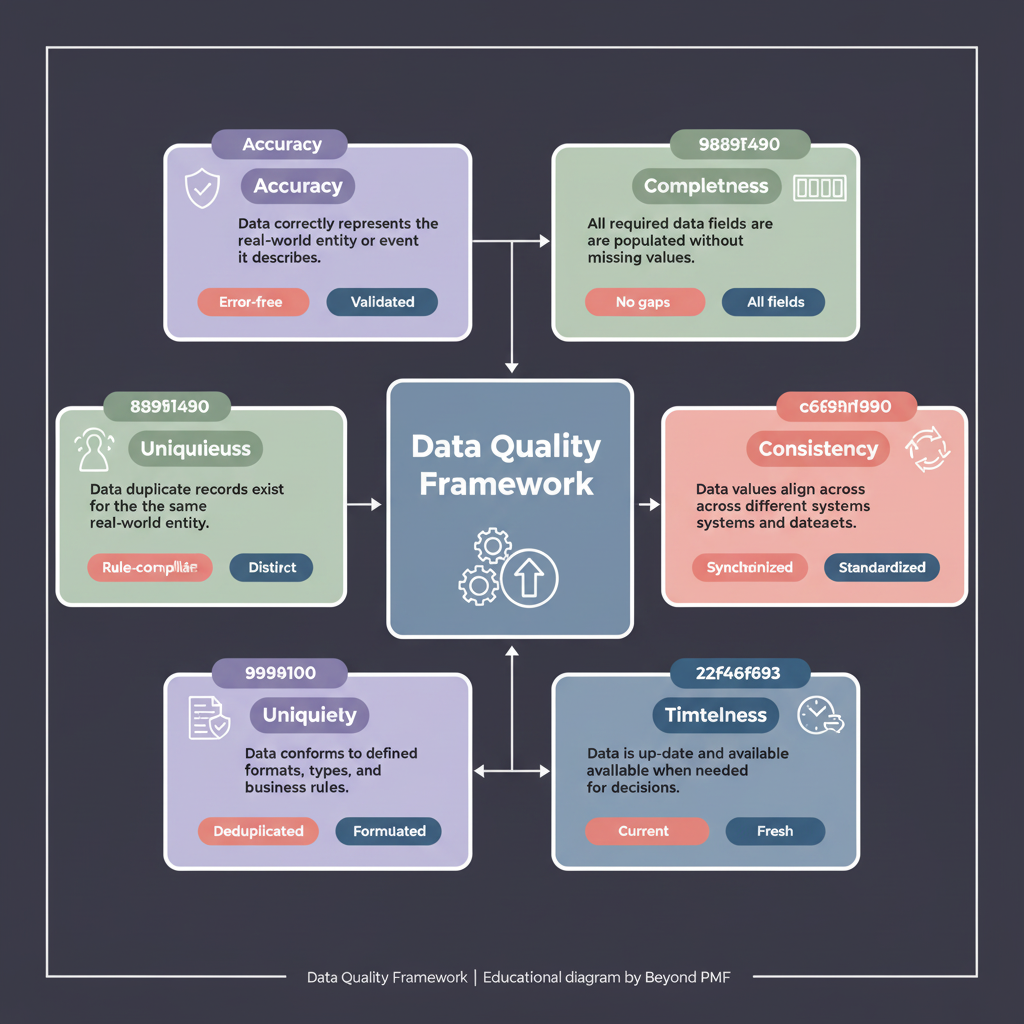
The Data Quality Framework provides a systematic methodology for ensuring that data meets the standards of accuracy, completeness, reliability, and relevance required for business operations. It involves processes and tools that help identify, understand, and rectify data quality issues. This framework is crucial for organizations that rely on data for decision-making, as it directly impacts the effectiveness of business strategies and customer satisfaction.

The Evaluation Framework is a structured approach designed to assess the performance and outcomes of projects or initiatives. It helps organizations determine whether their efforts are achieving desired goals, identify areas for improvement, and ensure accountability. Utilizing this framework can lead to enhanced decision-making, better resource allocation, and improved program effectiveness.
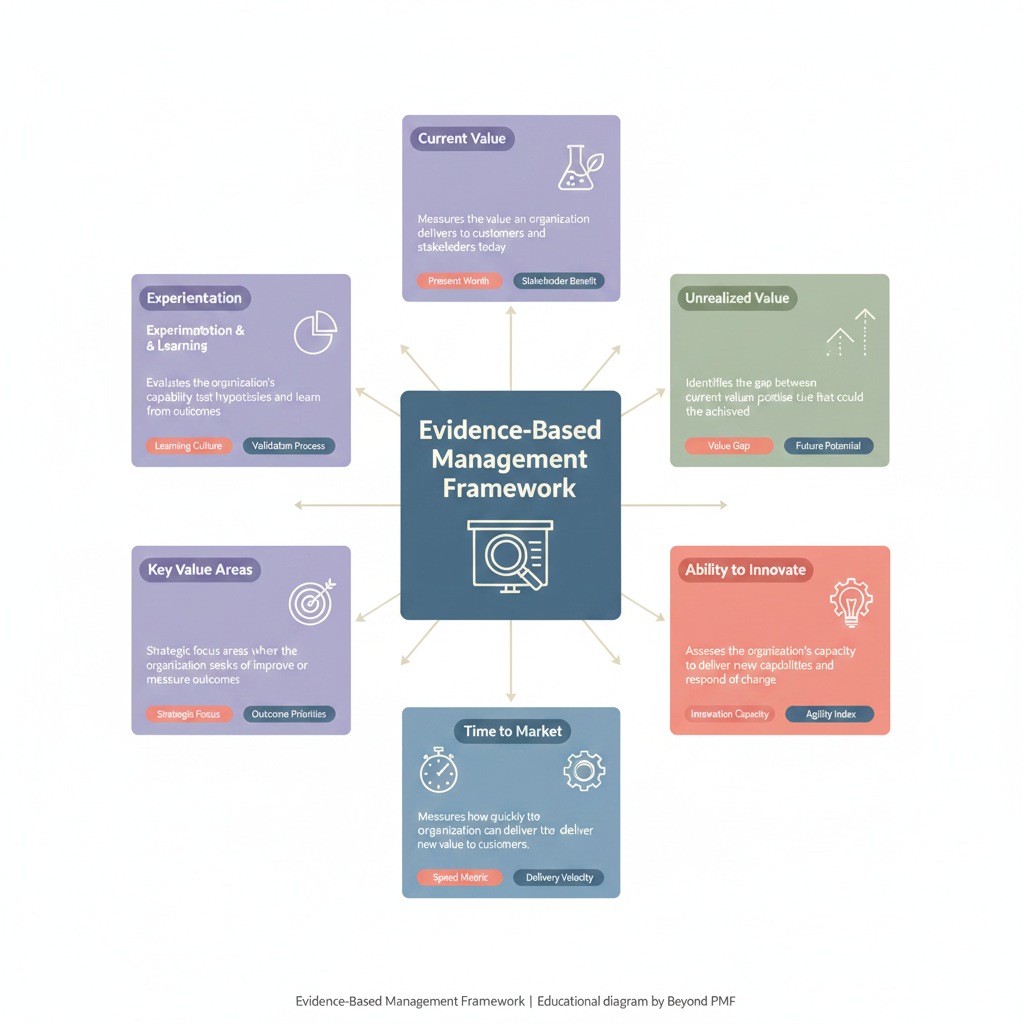
The Evidence-Based Management Framework is a methodological approach used by organizations to make informed decisions based on critical evaluation of data from various sources. It emphasizes the use of empirical evidence to guide strategies and improve operational effectiveness. By integrating scientific evidence, organizational facts, professional expertise, and stakeholder values, this framework helps in reducing biases, enhancing transparency, and promoting better outcomes.

Funnel Analysis is a powerful analytical framework that helps businesses visualize the flow and conversion of potential customers through different stages of a purchasing process. It is primarily used to identify bottlenecks and optimize each stage for better conversion rates. This framework is beneficial for improving efficiency, maximizing conversion, and understanding customer behavior.
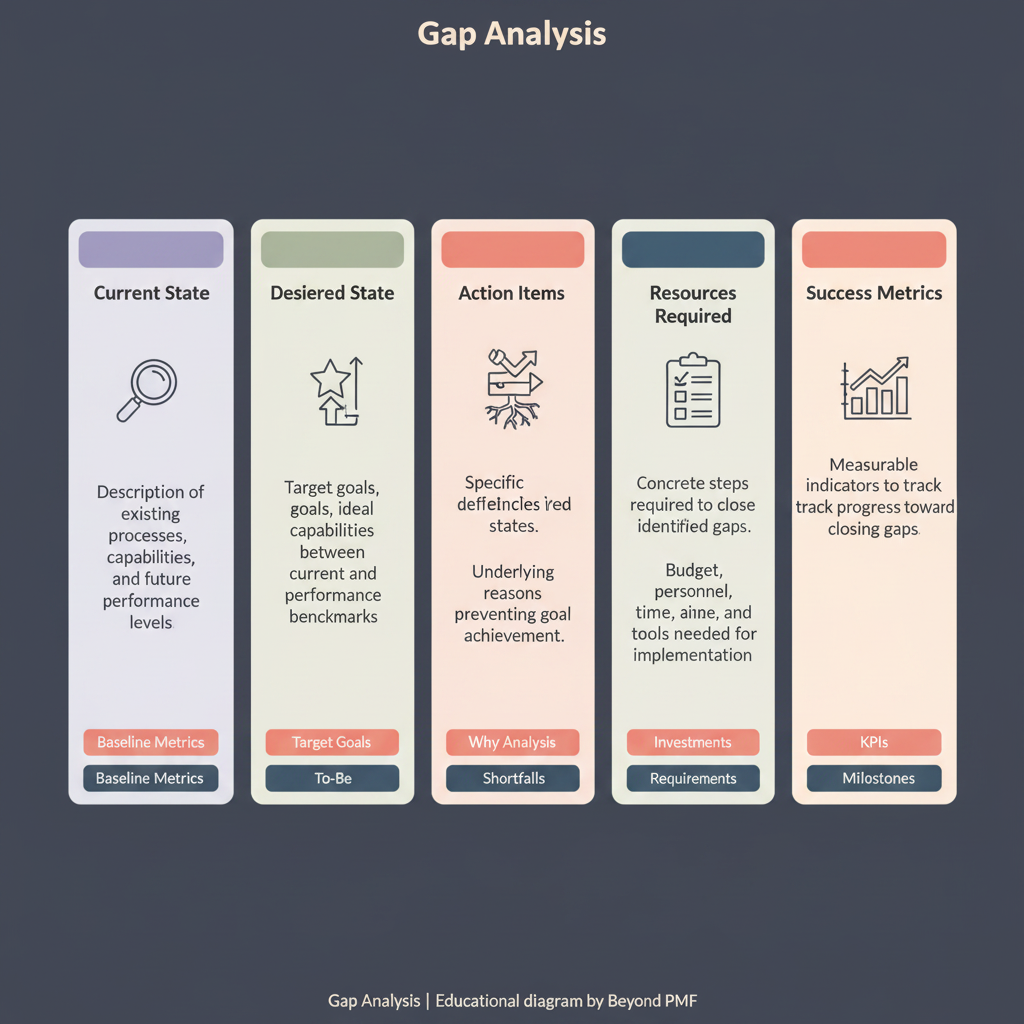
Gap Analysis is a strategic tool used by businesses to compare their current performance with their desired outcomes. It helps in identifying the gaps in performance, resources, or capabilities that prevent a company from reaching its objectives. This analysis is crucial for strategic planning, resource allocation, and enhancing operational efficiency. By pinpointing specific areas of improvement, organizations can develop targeted strategies to bridge these gaps, thereby facilitating growth and improvement.

The Google HEART Framework helps teams measure the quality of user experience in products and services. It focuses on five key user experience factors: Happiness, Engagement, Adoption, Retention, and Task Success. This framework is used to align user experience outcomes with business goals, making it easier to quantify intangible aspects of user interactions.
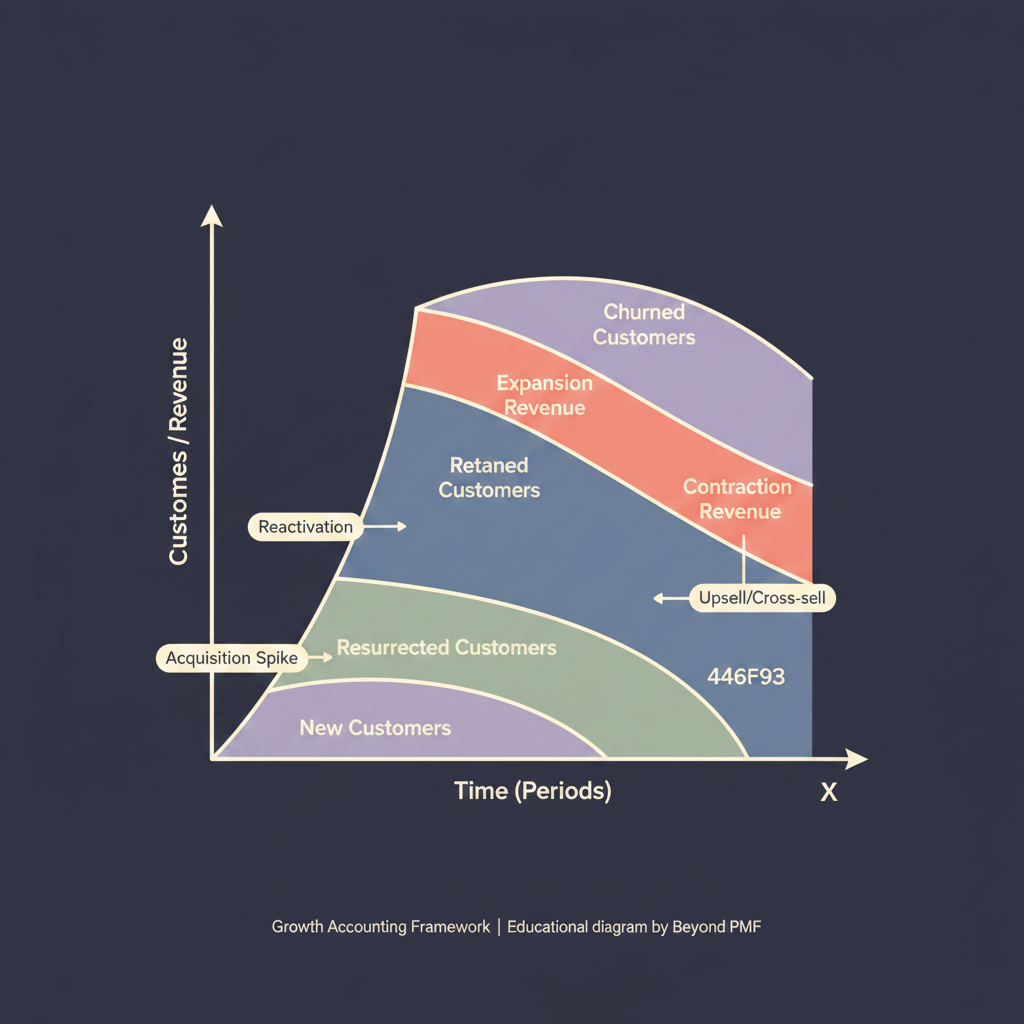
The Growth Accounting Framework is an analytical tool used primarily in economics to break down the various factors contributing to economic growth. It quantifies the extent to which growth can be attributed to labor (increase in workforce or hours worked), capital (increase in capital goods), and technological progress (improvements in productivity). This framework helps policymakers and economists understand the drivers of economic growth and devise informed strategies to foster further development.
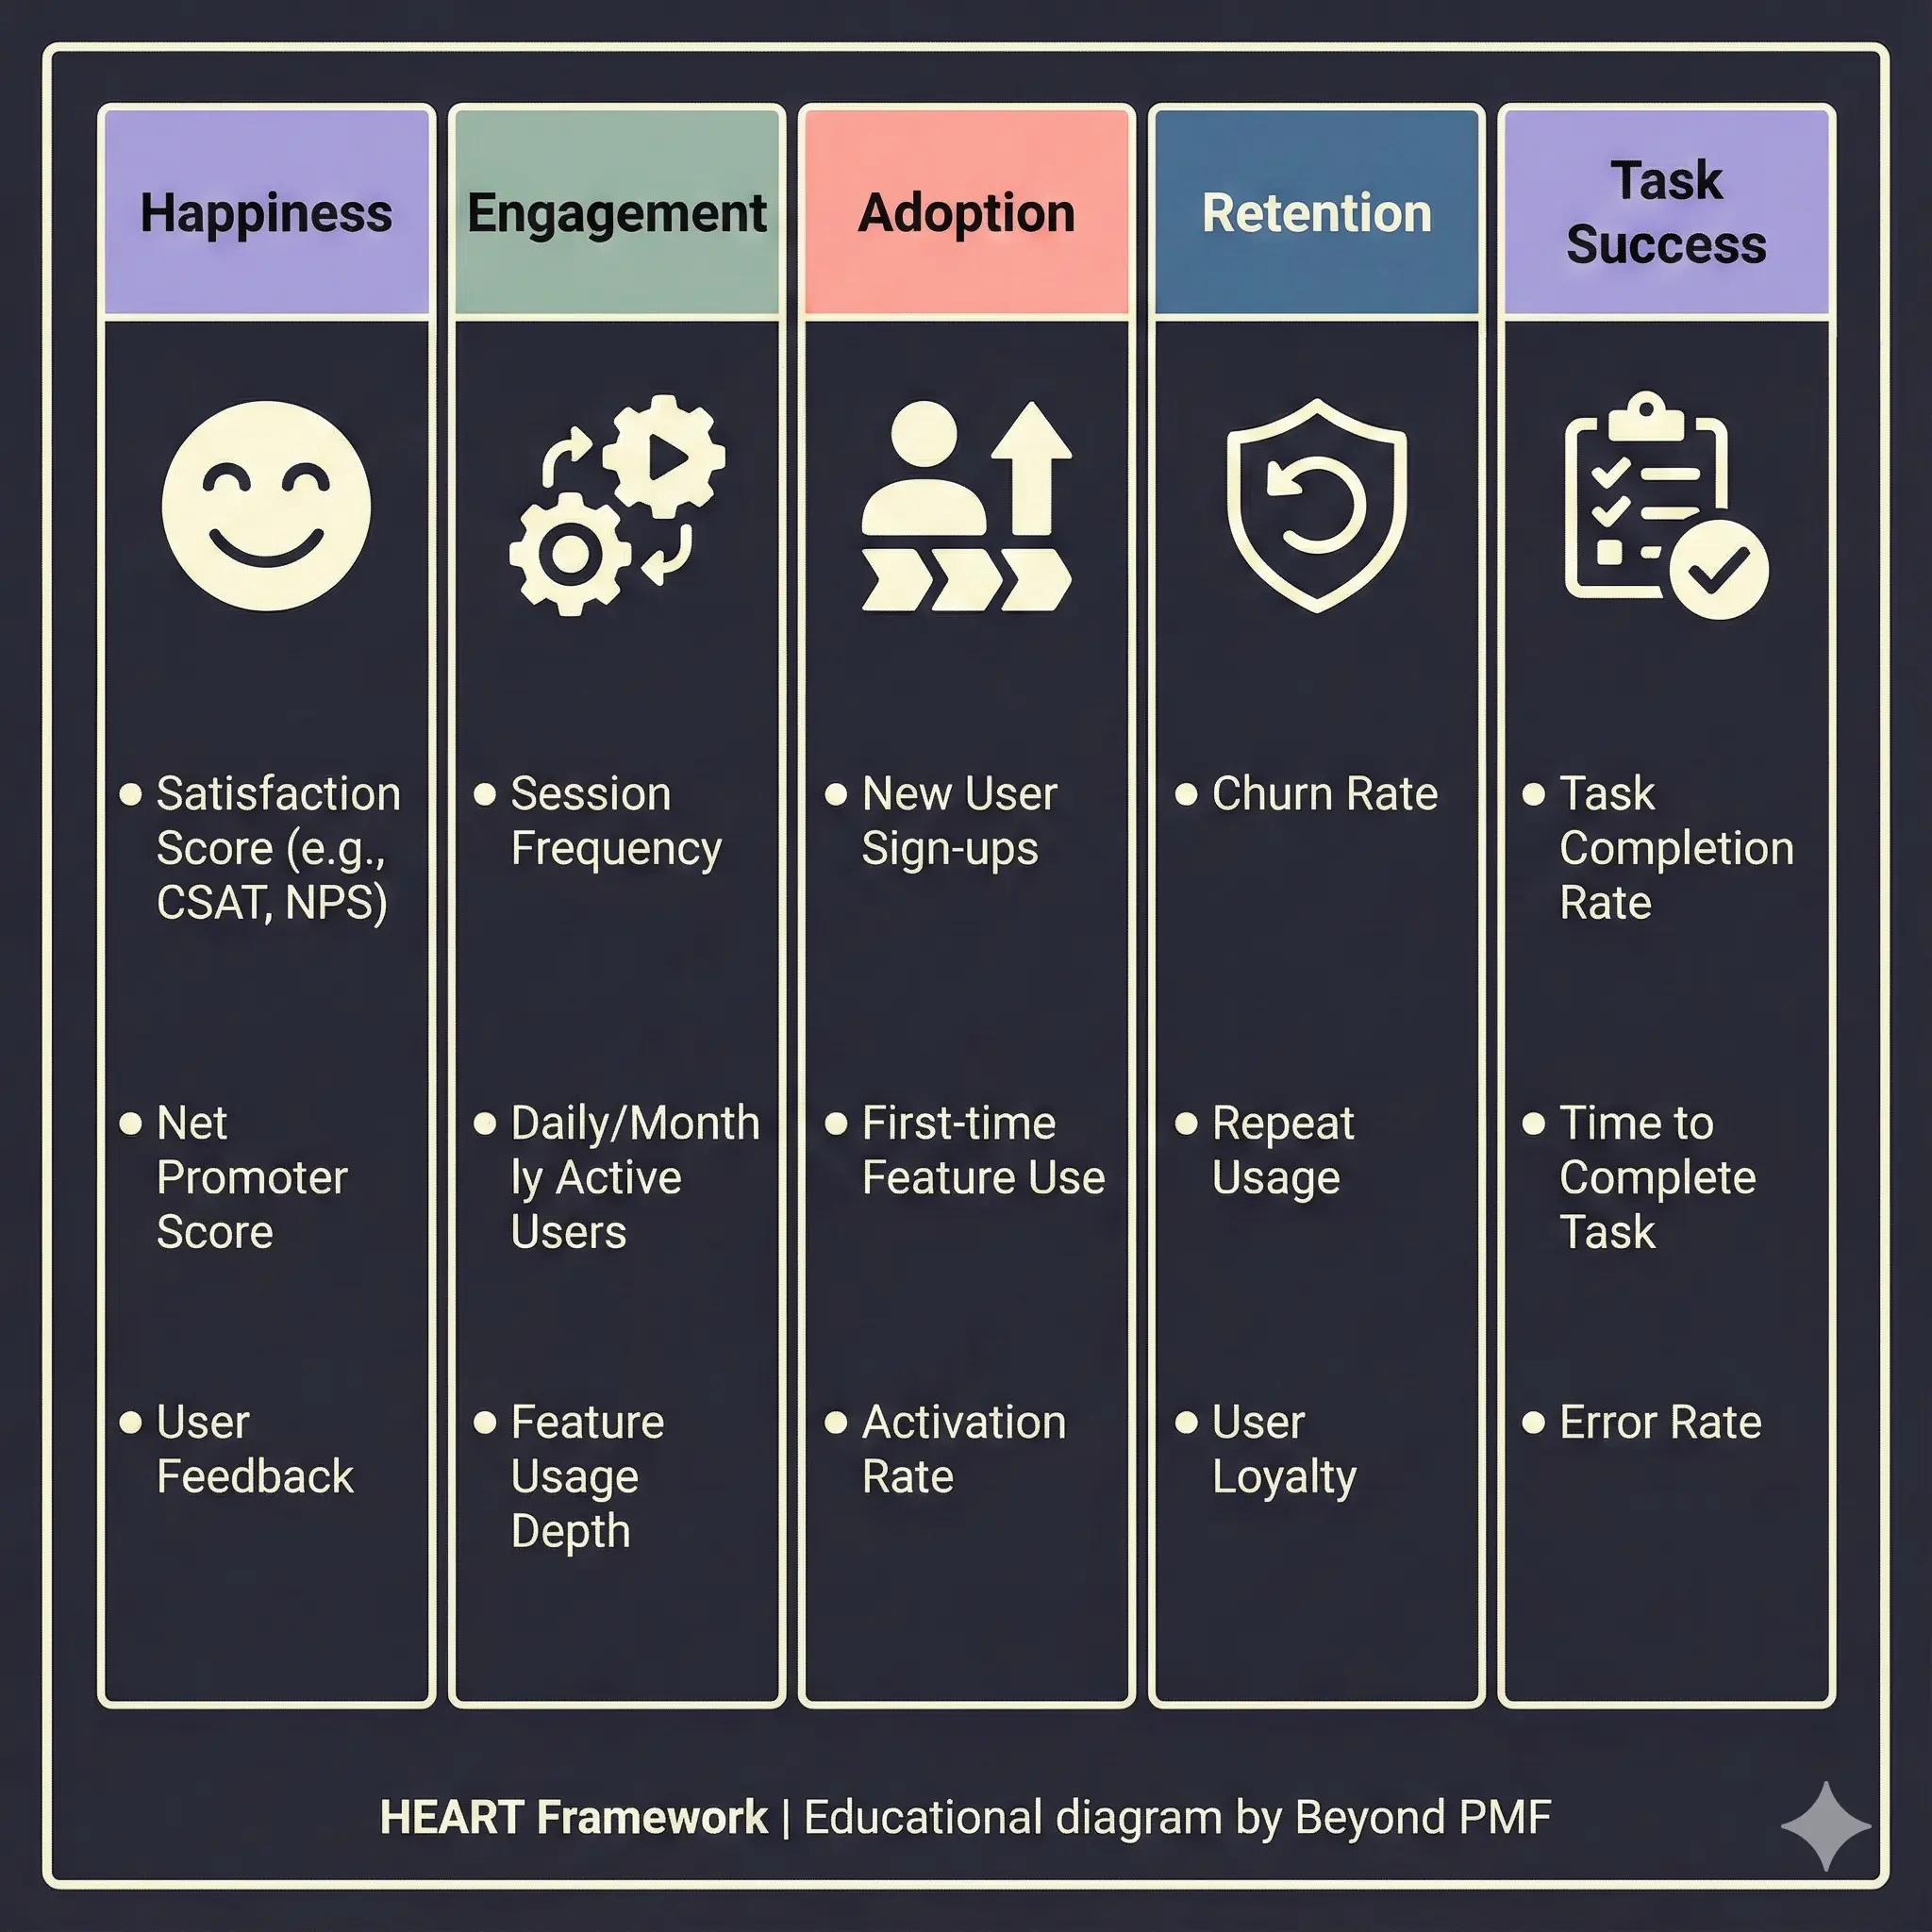
The HEART Framework, developed by Google, helps organizations measure and optimize user experience across five key dimensions: Happiness, Engagement, Adoption, Retention, and Task Success. It is used to align user experience outcomes with business goals, providing a clear and structured approach to understanding user interactions. The framework is beneficial for its ability to focus on user satisfaction and performance, making it ideal for improving product interfaces and services.

The HEART-RAILS Metrics Framework combines the HEART metrics for user experience outcomes with a structured RAILS approach to systematically evaluate each aspect of user interaction. It is used to identify strengths and weaknesses in user experience, facilitating targeted improvements. This framework is beneficial for its holistic view of both qualitative and quantitative aspects of user engagement.

The Hypothesis Testing Framework is a statistical tool used to infer the validity of a hypothesis made regarding a data sample. It is primarily utilized to determine if patterns and results observed in data are due to chance or if they are statistically significant. This framework helps in decision-making processes by providing a structured way to validate assumptions and can be crucial in fields such as science, business, and social research.
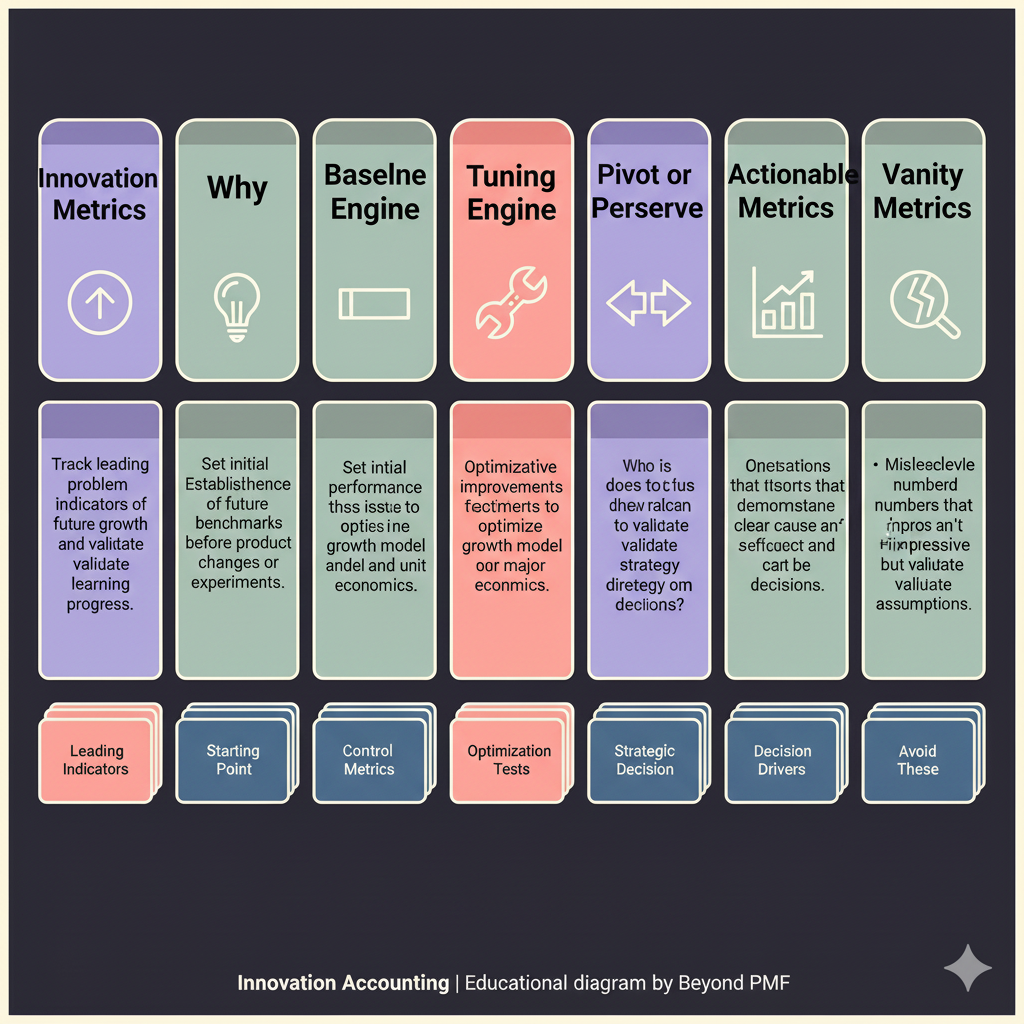
The Innovation Accounting Framework is designed to provide a structured approach to assess and track the performance of innovation within a company, especially when traditional metrics are not applicable. This framework helps organizations to make informed decisions by evaluating experiments and learning iterations, rather than just financial metrics. It is particularly useful in early-stage startups and new product development in larger companies where future revenues and traditional metrics are unknown.

The Innovation Metrics Framework is designed to provide businesses with a systematic approach to quantifying the impact of their innovation efforts. It helps organizations identify which areas of innovation are yielding results and which are not, facilitating better allocation of resources and strategic planning. The framework is essential for fostering a culture of continuous improvement and ensuring that innovation aligns with overall business objectives.
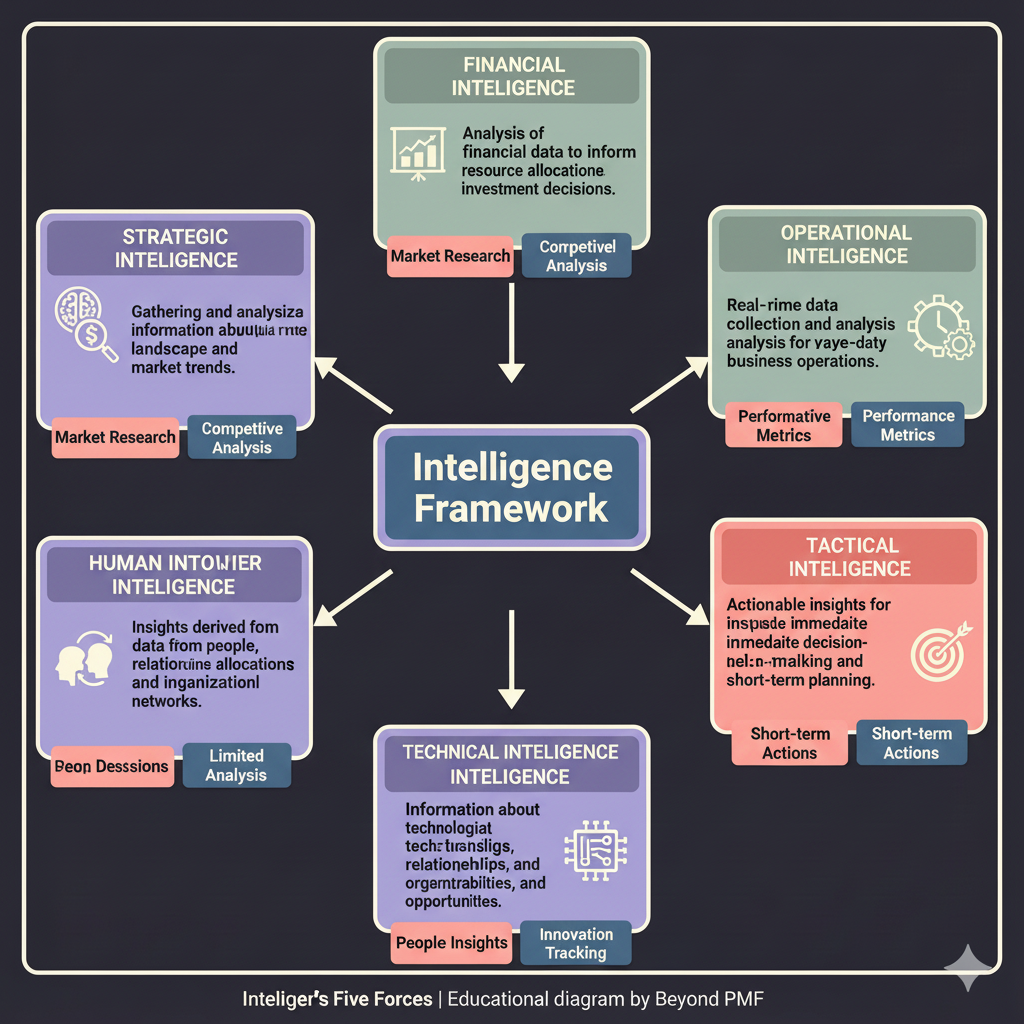
The Intelligence Framework is designed to systematically gather, analyze, and apply information to make informed business decisions. It helps organizations identify threats and opportunities in their external environment, facilitating proactive strategies. The framework is beneficial for enhancing data-driven decision-making, improving competitive advantage, and optimizing strategic planning processes.

Judgmental Forecasting is a method that relies on the subjective judgment of experts to make predictions about future outcomes. This approach is particularly useful in scenarios where quantitative data is scarce, unreliable, or where rapid changes render historical data less relevant. It is often used to forecast new products, technology adoption rates, or market trends, providing a flexible and quick forecasting tool.

Key Driver Analysis (KDA) is a statistical method used to determine which factors are most influential in affecting a particular outcome or variable of interest. It helps businesses and researchers understand the relationships between variables and the strength of these relationships. This analysis is crucial for making informed decisions, prioritizing resources, and improving performance based on empirical data. The insights gained from KDA can guide strategic planning and operational improvements.

The Key Performance Indicators (KPI) Framework is a systematic approach used by businesses to define and measure progress toward organizational goals. KPIs are quantifiable measurements that reflect the critical success factors of an organization. This framework helps in tracking efficiency, effectiveness, and overall performance, providing insights that aid in decision-making and strategic planning. The use of KPIs enhances the ability to monitor achievements and identify areas needing improvement, thus fostering better operational control and strategic alignment.
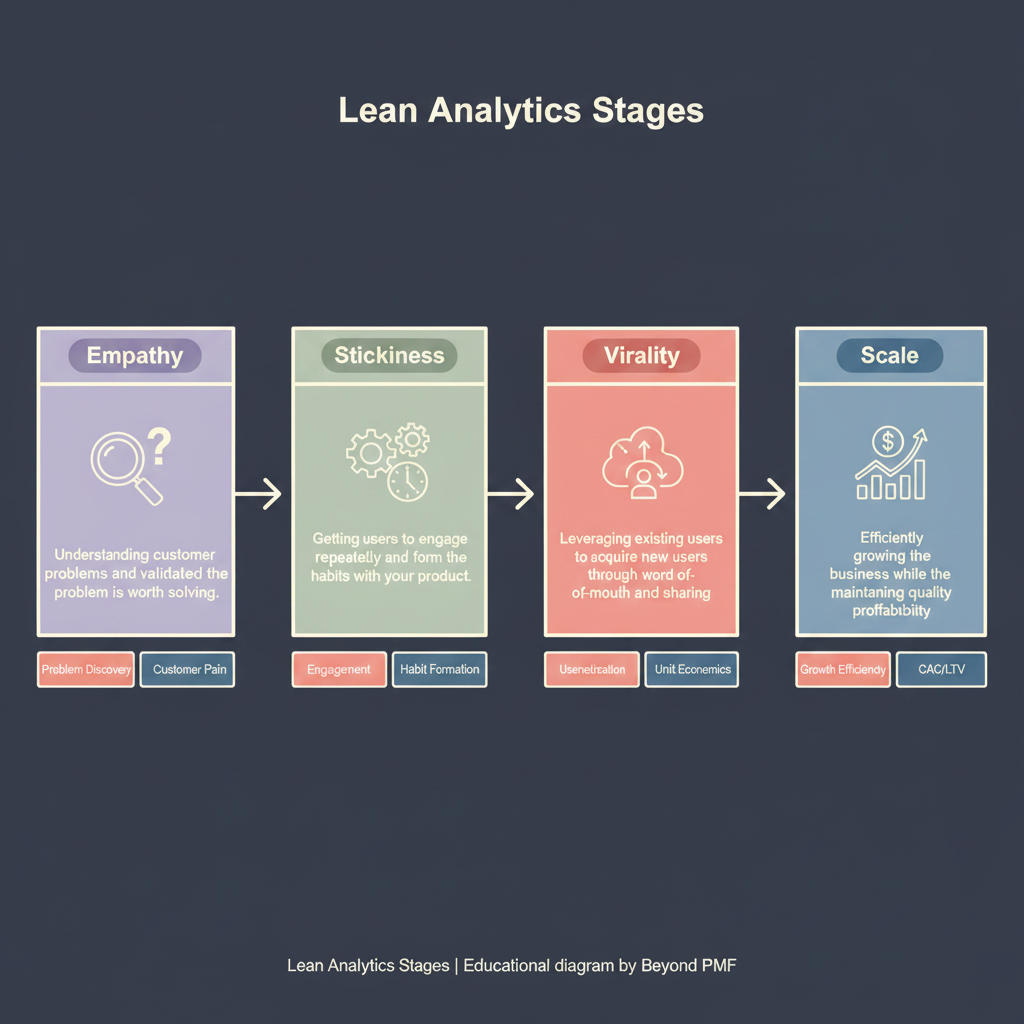
The Lean Analytics Stages framework is a methodology that helps startups and new ventures to focus on what is most important at each stage of their business development. By identifying and analyzing the right metrics, businesses can make informed decisions that drive growth and efficiency. This framework is particularly beneficial for rapidly iterating startups that need to constantly adapt and refine their strategies based on actionable data insights.

Lifetime Value (LTV) Analysis Framework is a strategic tool used by businesses to estimate the total revenue a customer will contribute over the entirety of their relationship with the company. This framework is crucial for understanding customer profitability, guiding marketing investments, and optimizing customer relationship management strategies. It helps in identifying high-value customer segments and allocating resources effectively to maximize long-term business gains.
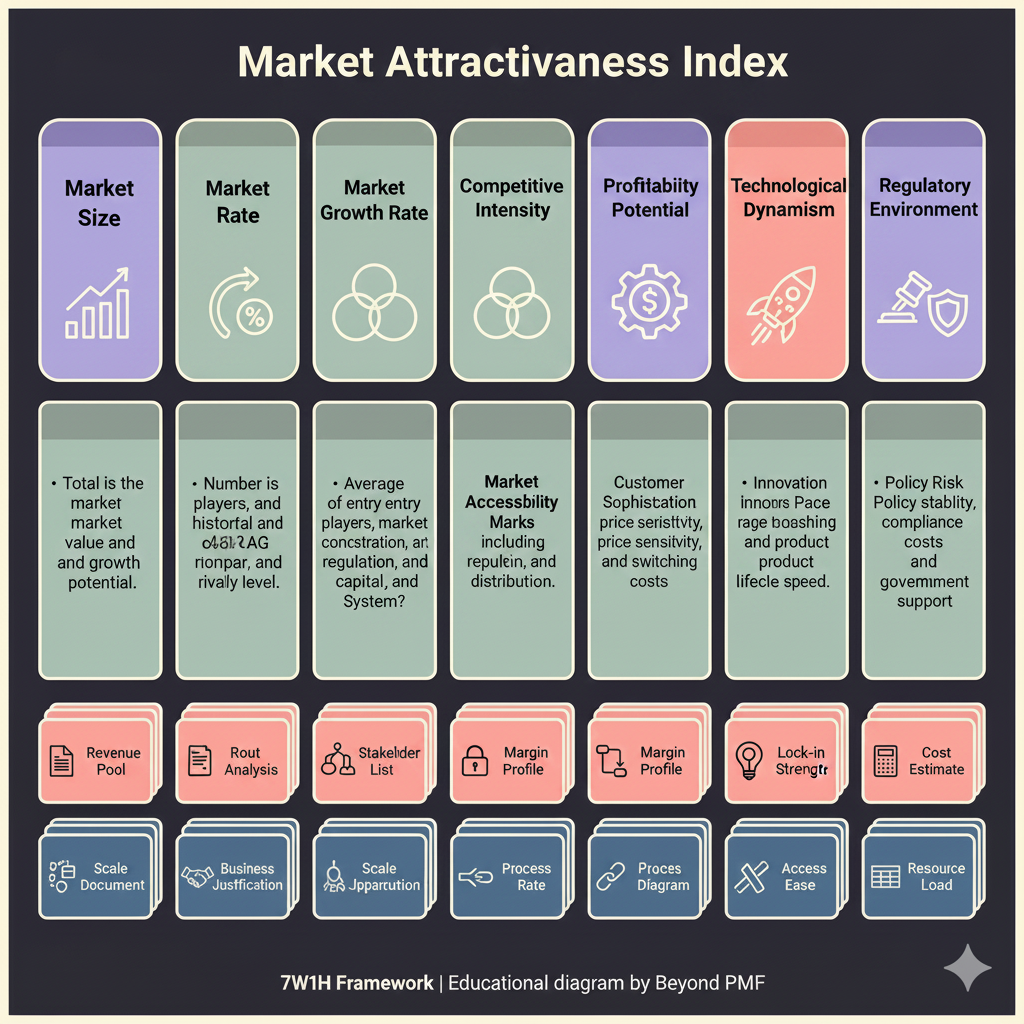
The Market Attractiveness Index is a strategic tool used by businesses to assess the attractiveness of different market segments or geographies. This framework helps in identifying the most lucrative markets by analyzing factors such as market size, growth rate, competition, and profitability. It aids companies in prioritizing their resources and investments efficiently, ensuring that they focus on markets with the highest potential for success.
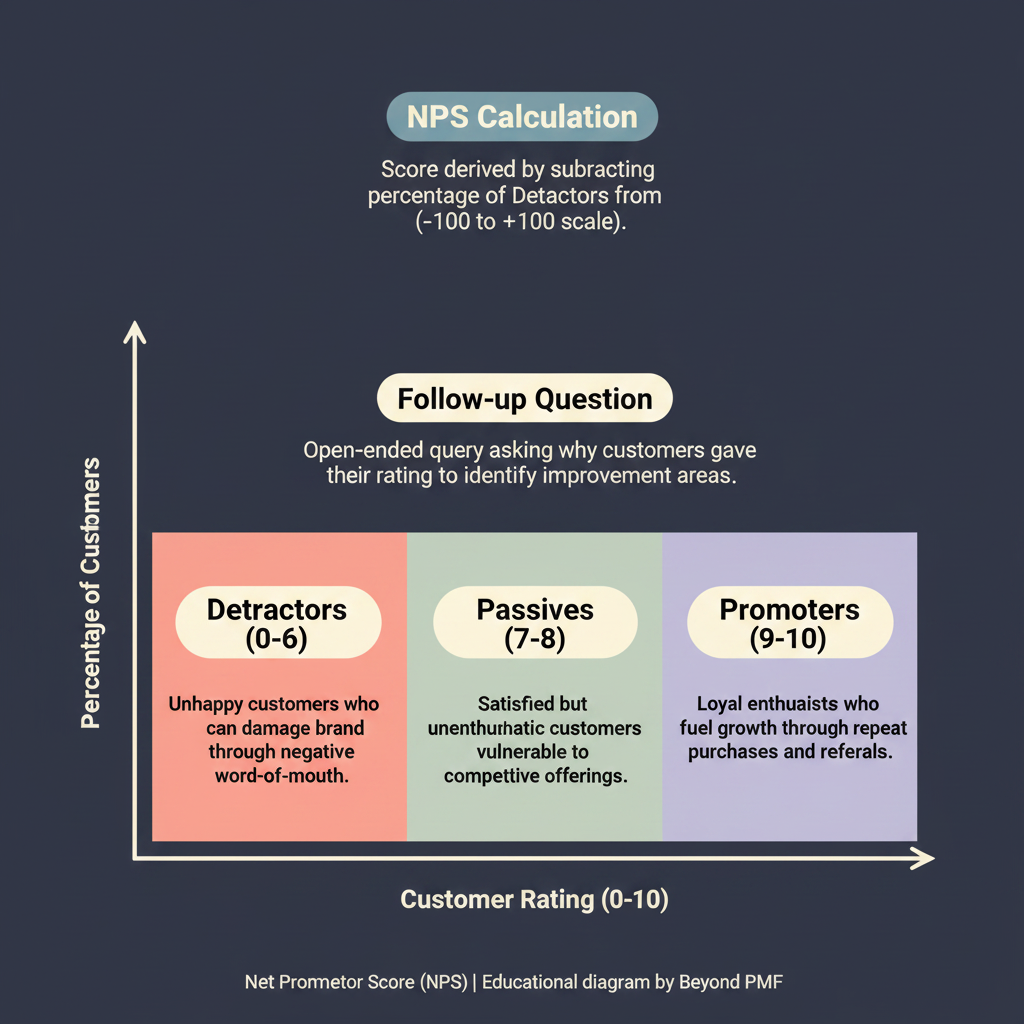
Net Promoter Score (NPS) is a widely used market research metric that measures the likelihood of customers to recommend a company's products or services to others. It is calculated based on responses to a single question: 'How likely are you to recommend our company/product/service to a friend or colleague?' The responses are used to classify customers into Promoters, Passives, and Detractors. NPS is a strong indicator of customer overall satisfaction and loyalty, and it provides actionable insights to improve service, product, or customer relationships.
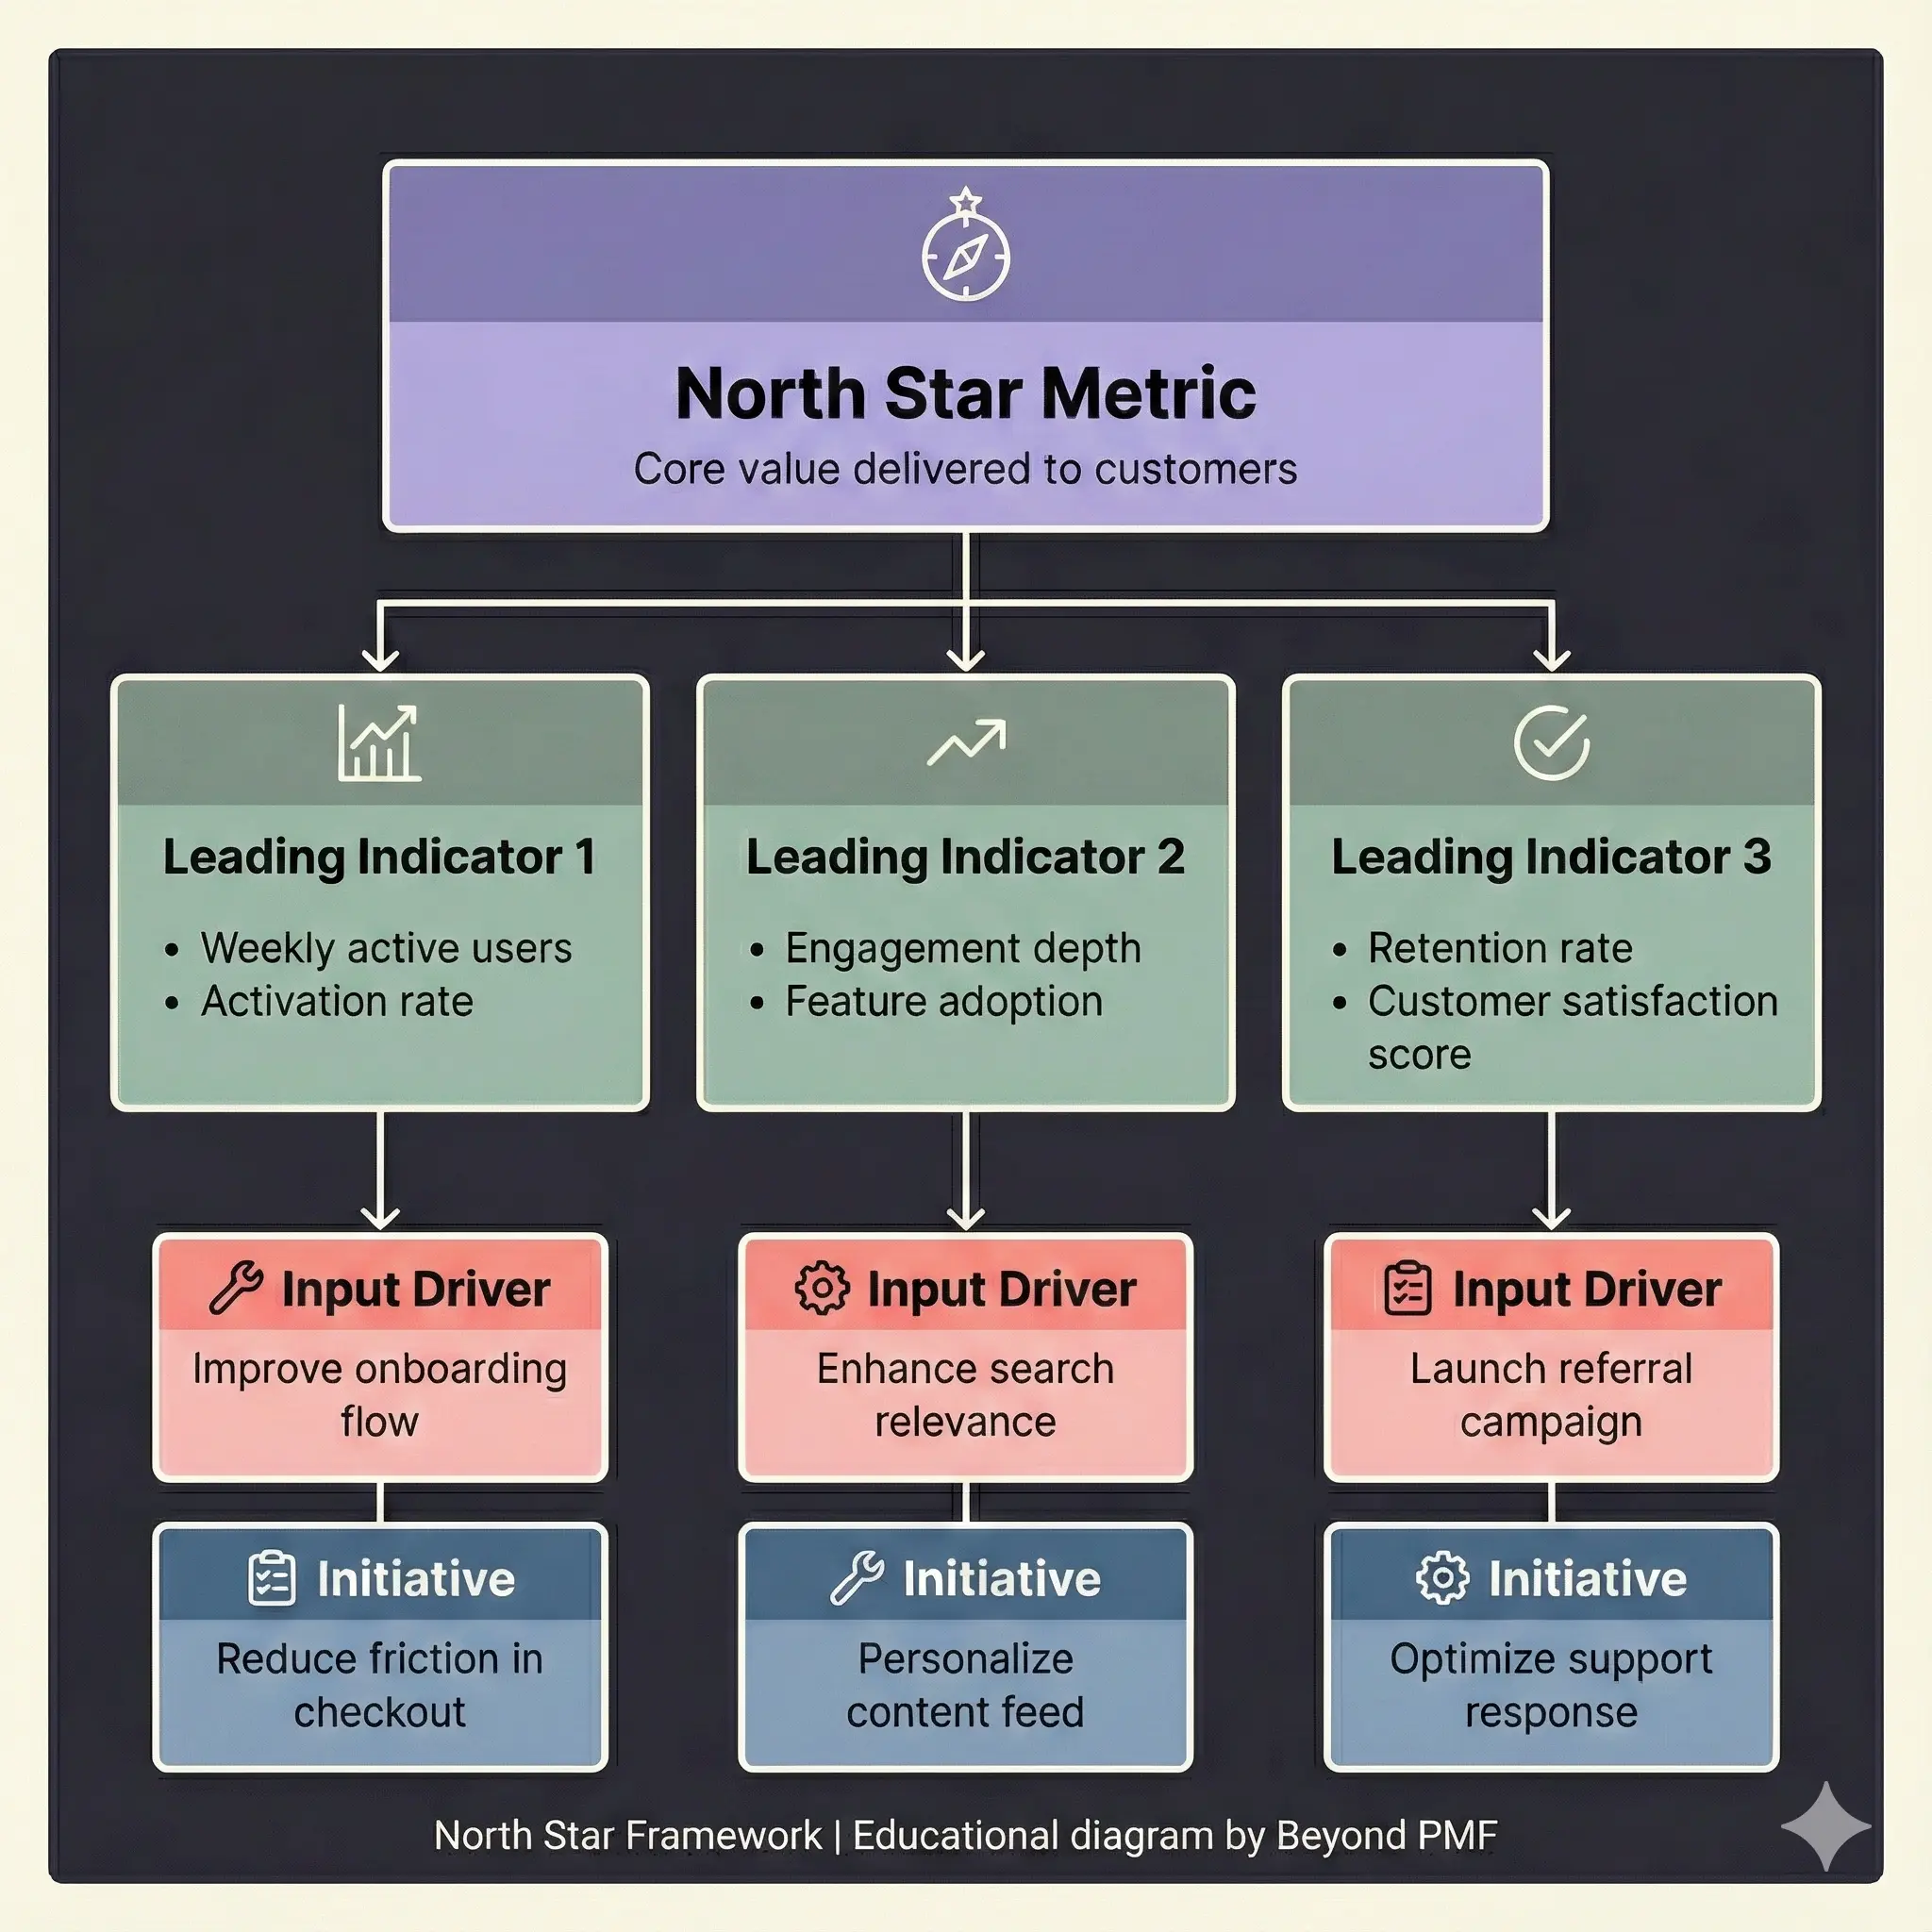
The North Star Framework helps organizations define a single, crucial metric that reflects the core value they provide to their customers, known as the North Star Metric. This metric guides all strategic decisions and product development efforts, ensuring that every team within the organization aligns with the overall goal. The framework encourages consistent growth and alignment by focusing on what truly matters to customers, thereby driving sustainable long-term success.
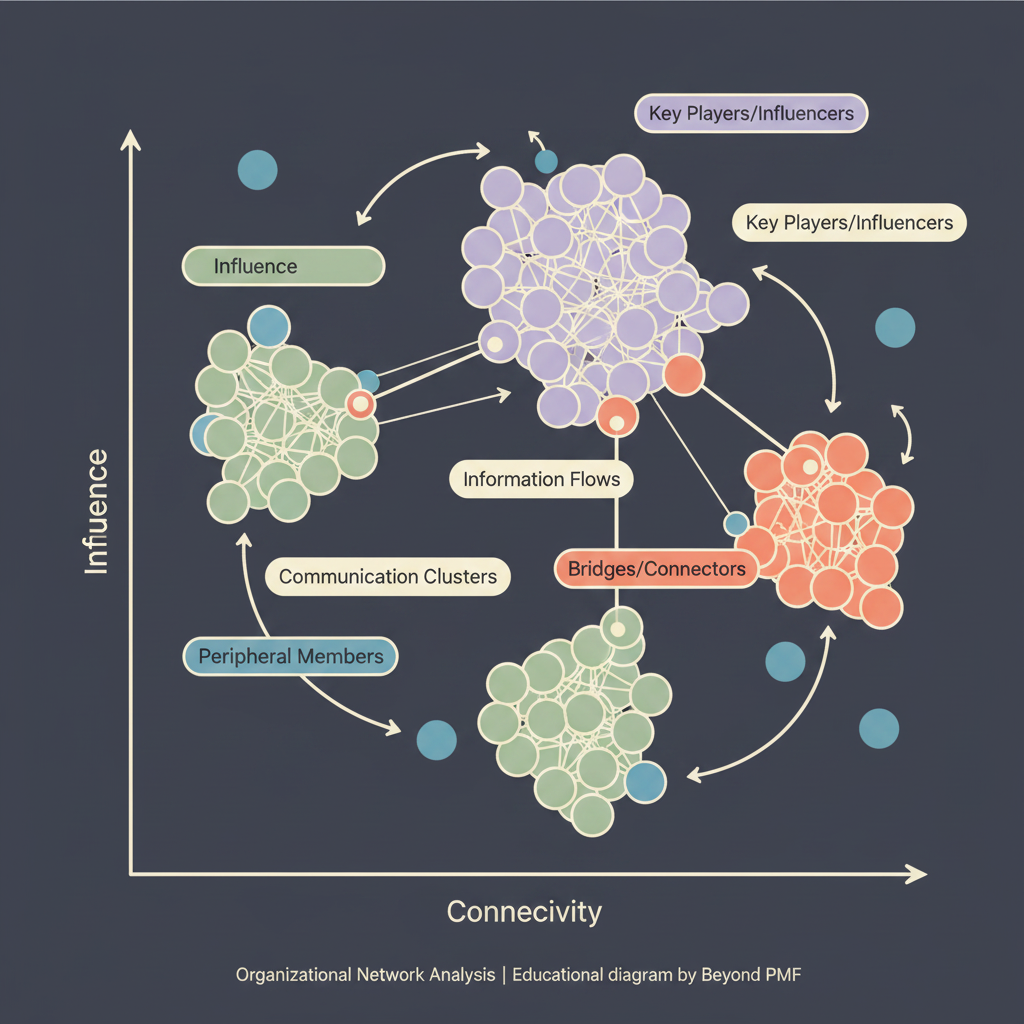
Organizational Network Analysis (ONA) is a framework used to visualize and analyze relationships and flows between people, groups, and divisions within an organization. It helps in identifying informal networks, key influencers, information bottlenecks, and collaboration patterns. The insights gained from ONA can be used to improve decision-making, increase efficiency, and enhance organizational performance by optimizing the flow of information and collaboration.

Pareto Analysis, also known as the 80/20 Rule, is a decision-making framework that helps prioritize tasks based on their impact. It operates on the principle that 80% of effects come from 20% of causes. Organizations and individuals use it to identify the most important factors in their processes, focusing resources on areas that yield the most significant results. This approach helps in optimizing efficiency and effectiveness in various operations.

The Product Health Metrics framework is a set of indicators used by companies to assess the performance, usability, and satisfaction associated with their products. This framework is crucial for identifying areas of improvement, ensuring customer satisfaction, and driving product strategy. By regularly reviewing these metrics, businesses can make informed decisions that enhance product features and user experience.
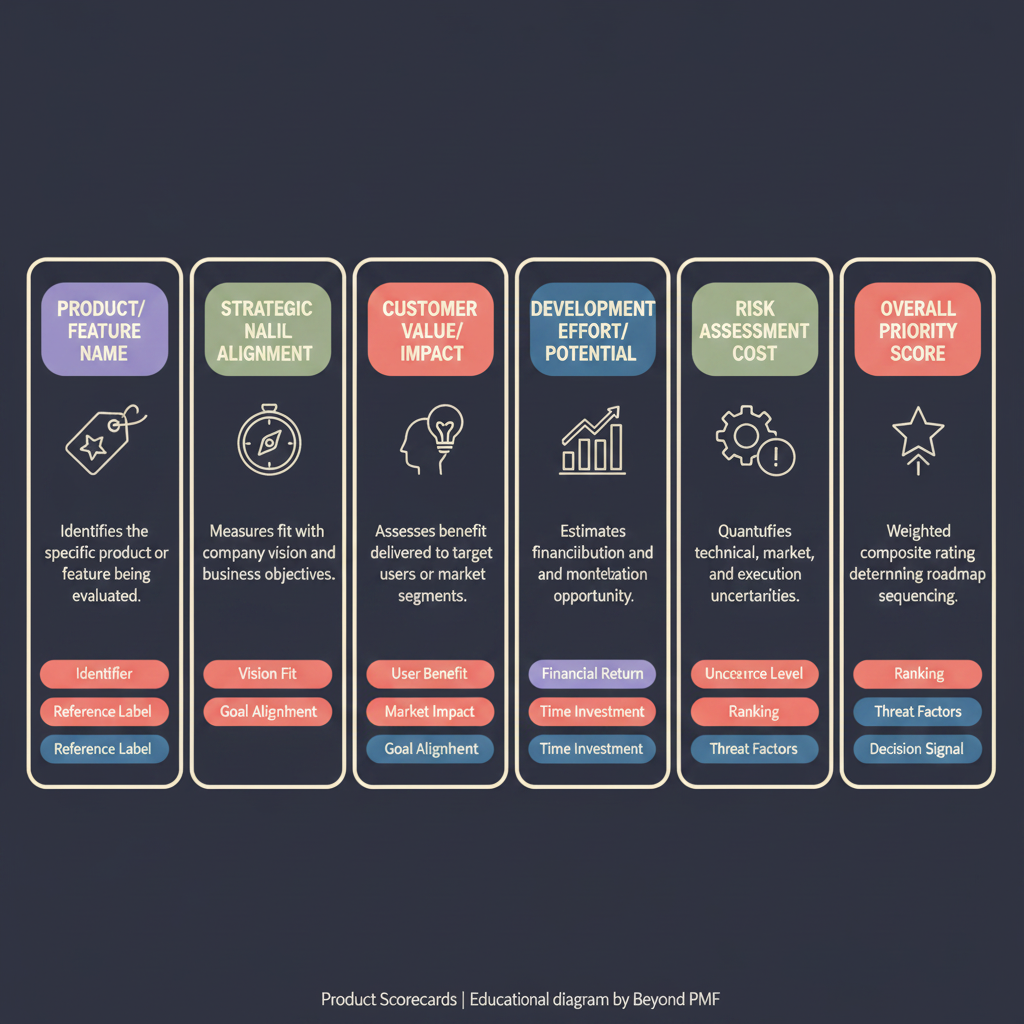
Product Scorecards are systematic frameworks used by businesses to evaluate the success of a product based on predefined metrics. These scorecards help in monitoring performance, identifying areas of improvement, and making informed decisions. The framework is beneficial for maintaining alignment with business goals, ensuring product quality, and enhancing customer satisfaction.

The Quality Metrics Framework provides a structured methodology for assessing and enhancing the quality of outputs in various industries. It focuses on identifying key quality indicators, setting benchmarks, and implementing continuous improvement processes. The framework is used to ensure products meet customer expectations and regulatory standards, thereby improving customer satisfaction and operational efficiency.
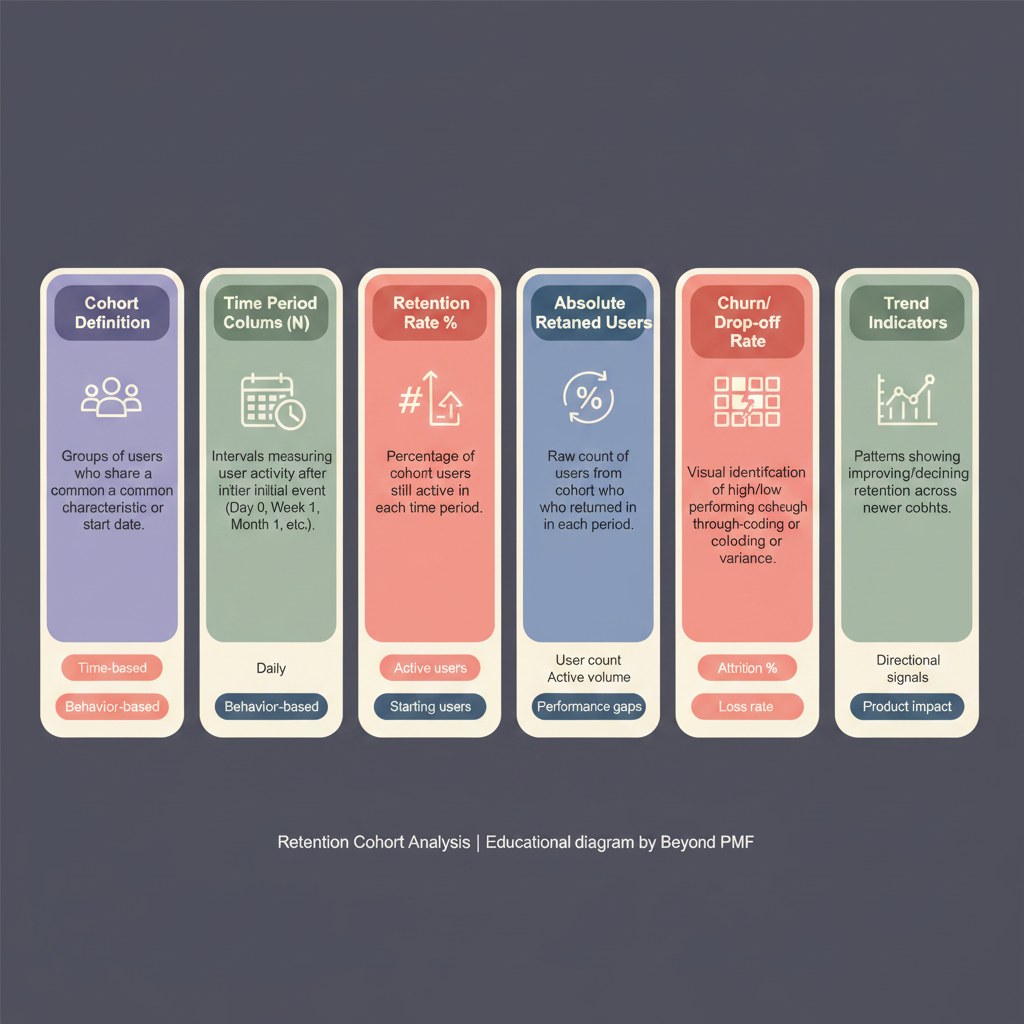
Retention Cohort Analysis is a framework that groups users based on their acquisition date and tracks their activity or retention over time. This approach helps businesses understand how well they are retaining customers and identify patterns in customer behavior. The analysis can reveal insights into the effectiveness of product changes, marketing efforts, and customer service improvements.

The Return-on-Investment (ROI) Calculator is a financial tool that helps businesses and investors determine the profitability of an investment. It calculates the percentage return on a particular investment relative to its cost, thereby providing a clear metric to assess the financial gain. The ROI Calculator is widely used because it simplifies complex financial assessments into a single percentage, making it easier to compare different investment opportunities.

RFM Analysis stands for Recency, Frequency, and Monetary value, each representing a specific aspect of customer behavior. This framework helps businesses identify which customers are more likely to respond to promotions and also provides insights into how to improve customer engagement. By segmenting customers based on these three variables, companies can tailor their marketing efforts more effectively, enhancing customer loyalty and increasing sales.

Social Return on Investment (SROI) is a framework that helps organizations to evaluate the broader impact of their actions in terms of social, environmental, and economic outcomes. It quantifies these impacts in monetary terms, allowing for a more comprehensive understanding of the value created by an investment. SROI is used to enhance decision-making, improve transparency, and provide a fuller picture of how an organization contributes to society.
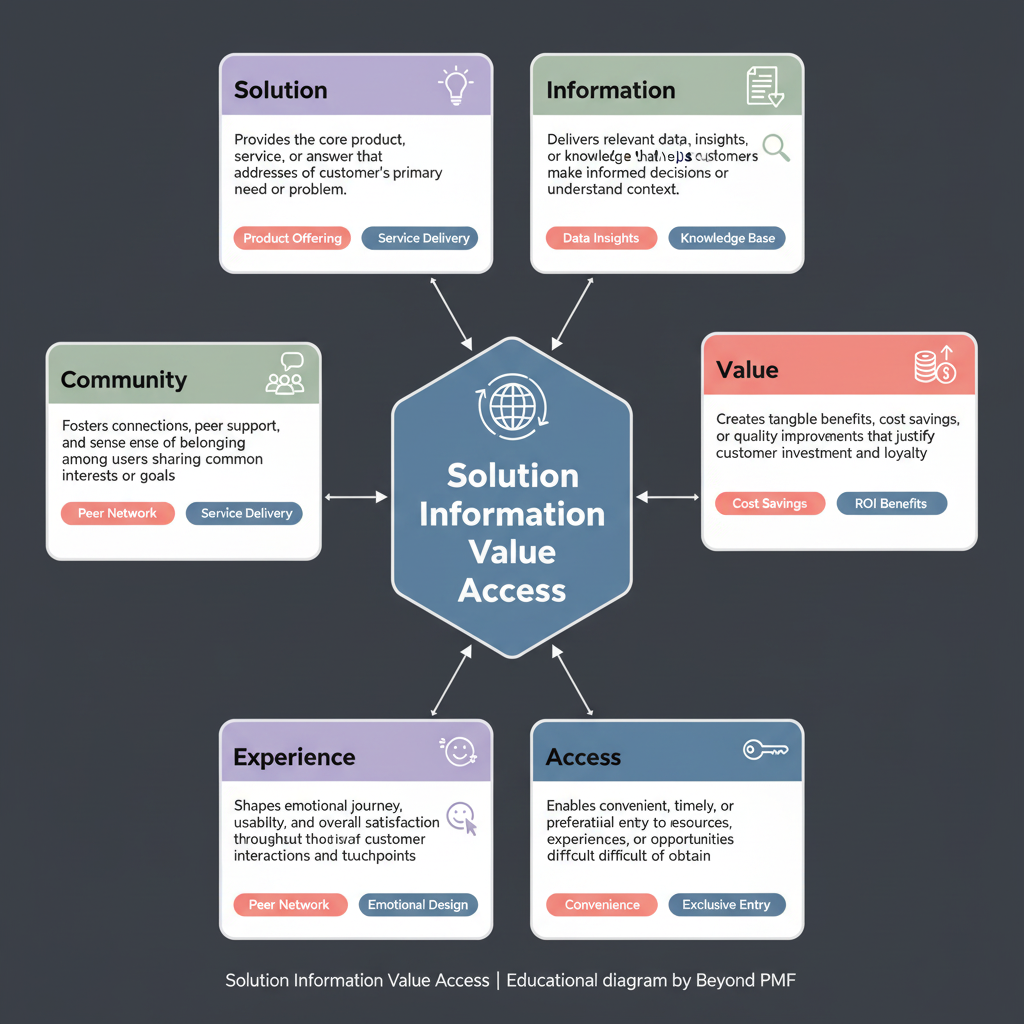
The Solution Information Value Access framework is designed to streamline how organizations handle and utilize information. It focuses on ensuring that the right information is available to the right people, enhancing the value derived from this information, and providing easy access to it. This framework is particularly beneficial in complex environments where decision-making is critical, helping to reduce errors and improve outcomes by leveraging accurate and timely information.
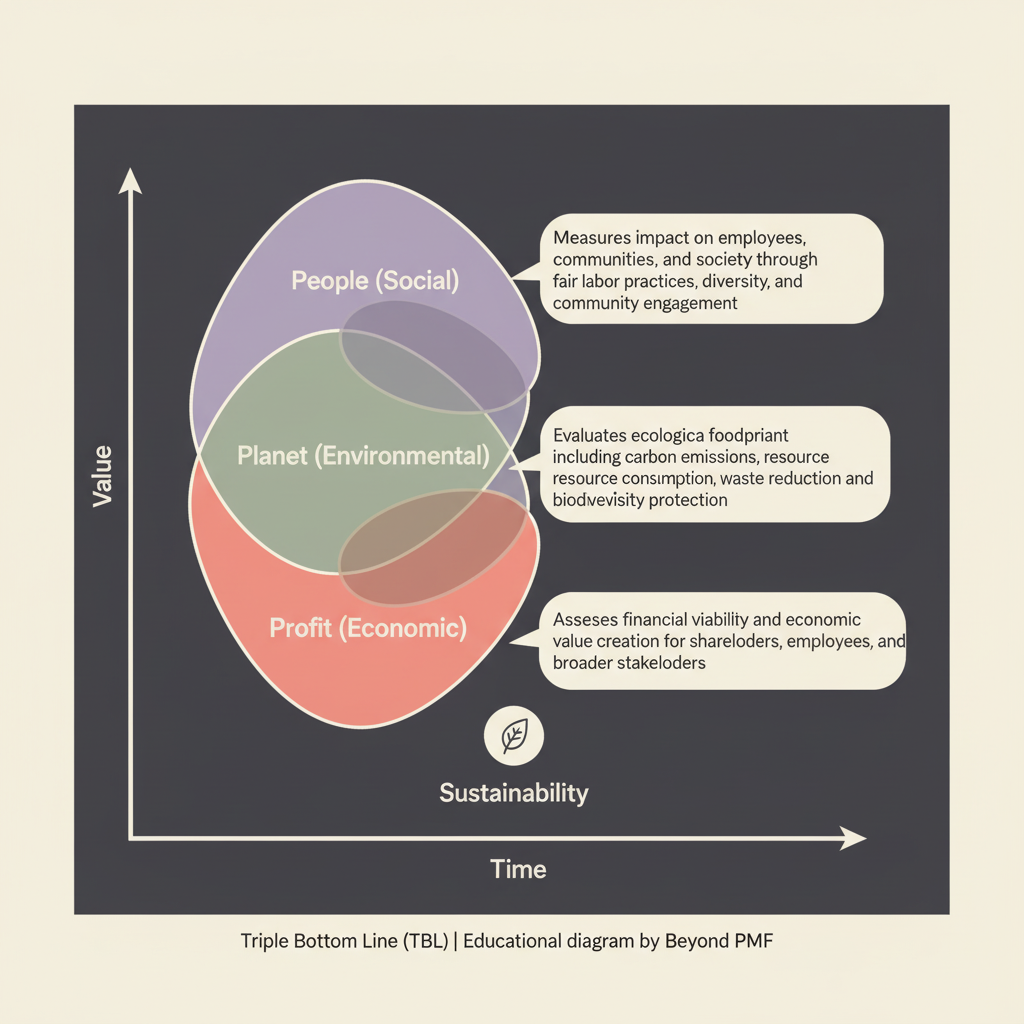
The Triple Bottom Line (TBL) framework encourages organizations to focus beyond the traditional financial bottom line to include social and environmental considerations. By evaluating performance in these three areas—often referred to as 'people, planet, profit'—companies can aim for sustainability in their business practices, ensuring they are socially responsible, environmentally sound, and economically viable. The TBL framework helps businesses identify potential areas for improvement and align their operations with broader societal goals.
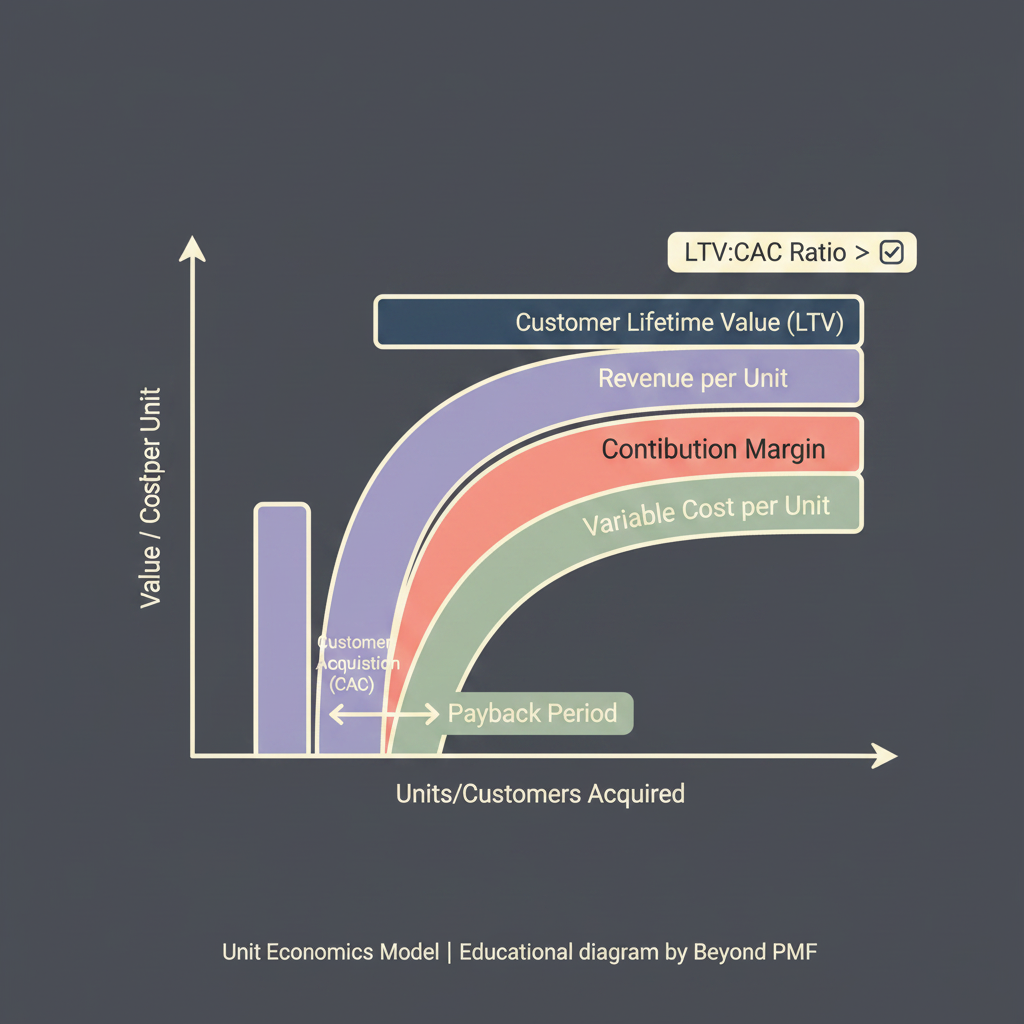
The Unit Economics Model focuses on the profitability of a single unit of product or service sold by a company. It calculates the revenue and costs associated with one unit, providing insights into the direct revenues and costs related to a product or service. This model is crucial for businesses to determine whether their products are financially viable on a per-unit basis. It helps in pricing strategies, cost management, and overall financial planning, making it a fundamental tool for startups and established businesses alike.

The Value Creation Index framework is a comprehensive tool used by businesses to assess their ability to create value over time. It incorporates a variety of metrics, including financial performance, innovation, customer satisfaction, and internal process efficiency. The framework helps companies identify areas of strength and weakness, enabling targeted improvements and strategic decision-making. Its use is crucial for maintaining competitive advantage and achieving sustainable growth.

The Value Innovation Framework focuses on the simultaneous pursuit of differentiation and low cost, aiming to create a leap in value for both the company and its customers. By analyzing the current market landscape and identifying the factors that drive customer value, organizations can innovate in ways that set them apart from competitors. This framework encourages businesses to rethink their offerings and explore new ways to deliver value, ultimately leading to the creation of uncontested market spaces.

The Value Proposition Calculator is a strategic framework designed to help businesses quantify the value their products or services offer to customers. It involves analyzing various factors such as customer needs, product features, and competitive positioning to assign a numerical value to the proposition. This framework is crucial for businesses to understand how well their offerings meet market demands and to communicate this value effectively to target audiences.