Net Promoter Score (NPS)

https://ik.imagekit.io/beyondpmf/frameworks/net-promoter-score-nps.png
NPS directly measures customer willingness to recommend, which is a key indicator of customer experience. By focusing on customer feedback and loyalty, it helps identify and address issues related to customer satisfaction and the overall delivery of products or services.

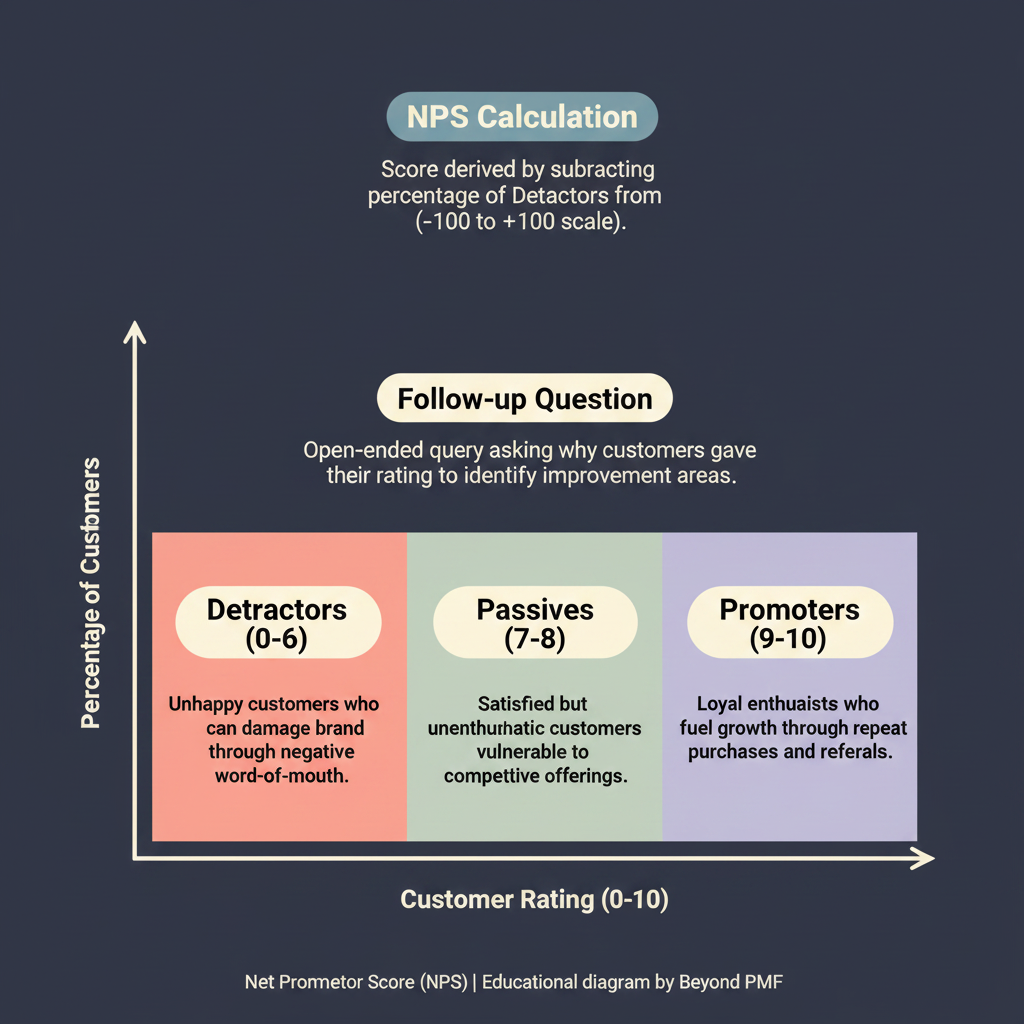
Net Promoter Score (NPS) is a widely used market research metric that measures the likelihood of customers to recommend a company's products or services to others. It is calculated based on responses to a single question: 'How likely are you to recommend our company/product/service to a friend or colleague?' The responses are used to classify customers into Promoters, Passives, and Detractors. NPS is a strong indicator of customer overall satisfaction and loyalty, and it provides actionable insights to improve service, product, or customer relationships.

Steps / Detailed Description

Survey your customers asking them how likely they are to recommend your product or service on a scale of 0-10. | Categorize the responses into Promoters (9-10), Passives (7-8), and Detractors (0-6). | Calculate the NPS by subtracting the percentage of Detractors from the percentage of Promoters. | Analyze the feedback to understand the reasons behind the scores provided. | Implement improvements based on the insights gained to increase the number of Promoters and reduce the number of Detractors.

Best Practices

Regularly conduct NPS surveys to track changes over time | Combine NPS with other metrics for a comprehensive view | Act on the feedback to improve customer satisfaction

Pros

Simple to implement and understand | Facilitates comparison across different units or time periods | Directly correlates to growth and customer loyalty

Cons

Does not provide detailed insights on its own | Can be influenced by cultural factors in global surveys | May overlook the middle group (Passives) who can be potential Promoters

When to Use

To measure customer loyalty and satisfaction | When evaluating the impact of a new product or service

When Not to Use

If detailed, qualitative feedback is required | When immediate, actionable customer feedback is needed

Related Frameworks

Categories

Lifecycle

Not tied to a specific lifecycle stage

Scope

Scope not defined

Maturity Level

Maturity level not specified

Time to Implement

2–4 Weeks
3–6 Months
1–2 Weeks
3–6 Months
1–2 Months
3–6 Months
1–2 Weeks
Less Than 1 Day
1–2 Weeks
Longer Than 6 Months
1–2 Weeks
Longer Than 6 Months
1–2 Weeks
3–6 Months
1–2 Weeks
1–2 Weeks
1–2 Weeks
1–2 Weeks
1–2 Days
1–2 Weeks
1–2 Weeks
1–2 Weeks
1–2 Weeks
1–2 Weeks
1–2 Weeks
3–6 Months
1–2 Weeks
1–2 Weeks
1–2 Weeks
3–6 Months
1–2 Weeks
1–2 Weeks
2–4 Weeks
1–2 Weeks
1–2 Days
1–2 Weeks
Longer Than 6 Months
3–6 Months
Longer Than 6 Months
1–2 Weeks
Longer Than 6 Months
3–6 Months
Less Than 1 Day
3–6 Months
1–2 Months
3–6 Months
Longer Than 6 Months
3–6 Months
Less Than 1 Day
1–2 Weeks
3–6 Months
3–6 Months
1–2 Weeks
3–6 Months
1–2 Weeks
1–2 Weeks
1–2 Days
1–2 Weeks
1–2 Months
Longer Than 6 Months
1–2 Weeks
Longer Than 6 Months
1–2 Weeks
3–6 Months
1–2 Weeks
Less Than 1 Day
1–2 Weeks
3–6 Months
1–2 Weeks
3–6 Months
1–2 Weeks
1–2 Weeks
Longer Than 6 Months
Less Than 1 Day
3–6 Months
Longer Than 6 Months
1–2 Months
1–2 Weeks
Longer Than 6 Months
1–2 Weeks
3–6 Months
1–2 Weeks
1–2 Weeks
3–6 Months
Less Than 1 Day
1–2 Weeks
1–2 Weeks
3–6 Months
3–6 Months
Less Than 1 Day
1–2 Weeks
Longer Than 6 Months
1–2 Months
1–2 Weeks
1–2 Weeks
1–2 Weeks
Longer Than 6 Months

Copyright Information

Autor:
Fred Reichheld, Bain & Company, Satmetrix
2003
Publication:
Harvard Business Review