Process Decision Program Chart

https://ik.imagekit.io/beyondpmf/frameworks/process-decision-program-chart.png
The PDPC directly addresses potential problems within a process. It helps identify risks that could disrupt workflows and provides a mechanism to establish counter-measures to maintain operational effectiveness and coordination.

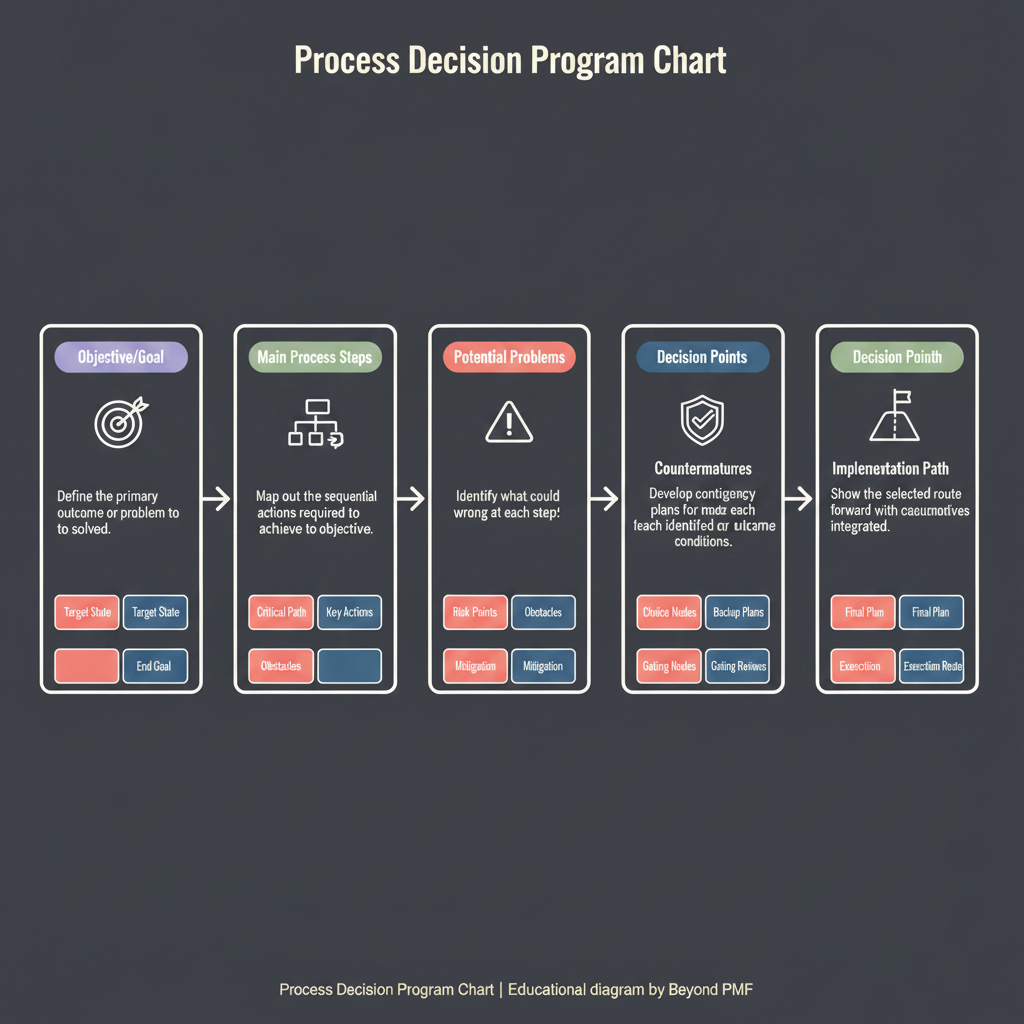
The Process Decision Program Chart (PDPC) is a systematic tool used in risk management and contingency planning. It helps organizations anticipate potential problems that could disrupt a process, and plan effective responses to mitigate these risks. The PDPC extends the Tree Diagram by identifying risks associated with each step in the process and outlining preventive measures and contingencies. This proactive approach not only helps in planning and decision-making but also enhances the reliability and efficiency of project execution.

Steps / Detailed Description

Define the final objective of the process or project. | Develop a tree diagram to break down the objective into smaller, manageable tasks or steps. | For each step, identify potential risks or problems that could prevent the step from being successful. | Brainstorm and list possible countermeasures to each identified risk. | Evaluate the feasibility and impact of each countermeasure. | Integrate the most effective countermeasures into the project or process planning.

Best Practices

Involve team members from different departments to get diverse perspectives on potential risks. | Regularly update the PDPC as the project progresses and new information becomes available. | Keep the chart simple and focused to avoid overwhelming details.

Pros

Enhances risk management by anticipating potential problems. | Facilitates proactive planning and contingency measures. | Improves project reliability and efficiency.

Cons

Can be time-consuming to identify and evaluate all potential risks. | May lead to over-planning, complicating simple projects. | Depends heavily on the accuracy of risk assessment.

When to Use

In complex projects where the cost of failure is high. | When planning new, untested processes.

When Not to Use

For very simple or routine projects. | When quick decision-making is required without time for detailed planning.

Related Frameworks

Categories

Lifecycle

Scope

Scope not defined

Maturity Level

Maturity level not specified

Time to Implement

2–4 Weeks
3–6 Months
1–2 Weeks
3–6 Months
1–2 Months
3–6 Months
1–2 Weeks
Less Than 1 Day
1–2 Weeks
Longer Than 6 Months
1–2 Weeks
Longer Than 6 Months
1–2 Weeks
3–6 Months
1–2 Weeks
1–2 Weeks
1–2 Weeks
1–2 Weeks
1–2 Days
1–2 Weeks
1–2 Weeks
1–2 Weeks
1–2 Weeks
1–2 Weeks
1–2 Weeks
3–6 Months
1–2 Weeks
1–2 Weeks
1–2 Weeks
3–6 Months
1–2 Weeks
1–2 Weeks
2–4 Weeks
1–2 Weeks
1–2 Days
1–2 Weeks
Longer Than 6 Months
3–6 Months
Longer Than 6 Months
1–2 Weeks
Longer Than 6 Months
3–6 Months
Less Than 1 Day
3–6 Months
1–2 Months
3–6 Months
Longer Than 6 Months
3–6 Months
Less Than 1 Day
1–2 Weeks
3–6 Months
3–6 Months
1–2 Weeks
3–6 Months
1–2 Weeks
1–2 Weeks
1–2 Days
1–2 Weeks
1–2 Months
Longer Than 6 Months
1–2 Weeks
Longer Than 6 Months
1–2 Weeks
3–6 Months
1–2 Weeks
Less Than 1 Day
1–2 Weeks
3–6 Months
1–2 Weeks
3–6 Months
1–2 Weeks
1–2 Weeks
Longer Than 6 Months
Less Than 1 Day
3–6 Months
Longer Than 6 Months
1–2 Months
1–2 Weeks
Longer Than 6 Months
1–2 Weeks
3–6 Months
1–2 Weeks
1–2 Weeks
3–6 Months
Less Than 1 Day
1–2 Weeks
1–2 Weeks
3–6 Months
3–6 Months
Less Than 1 Day
1–2 Weeks
Longer Than 6 Months
1–2 Months
1–2 Weeks
1–2 Weeks
1–2 Weeks
Longer Than 6 Months

Copyright Information

Autor:
Public Domain
N/A
Publication:
Generic Business Tool